
JPMorgan European
Discovery Trust plc
Uncovering Europe’s hidden gems
Annual Report and Financial Statements
for the Year Ended 31st March 2024
European Discovery AR 4pp cover.qxp 20/06/2024 09:47 Page FC1

Key Features
2 JPMorgan European Discovery Trust plc – Annual Report & Financial Statements 2024
Objective
Capital growth from smaller Continental European companies.
Investment Policies
• To invest in a diversified portfolio of high-quality smaller companies in Continental Europe.
• To emphasise capital growth rather than income. Shareholders should expect the dividend to vary from year to year.
• To manage liquidity and borrowings to increase potential returns to shareholders. The Board’s current gearing policy is to be
between 20% net cash and 20% geared.
• To invest no more than 15% of gross assets in other UK listed investment companies (including investment trusts).
Risk
The Company invests in the shares of smaller companies, which tend to be more volatile than those of larger companies. The
Company also employs gearing to generate greater returns. The Company’s shares should therefore be regarded as carrying
greater than average risk.
Further details on investment policies and risk management are given in the Strategic Report on page 33.
Benchmark
MSCI Europe (ex UK) Small Cap Net Total Return Index in sterling terms.
Capital Structure
At 31st March 2024, the Company’s issued share capital comprised 157,474,931 Ordinary shares of 5p each, of which 9,782,472
were held in Treasury.
Management Company
The Company employs JPMorgan Funds Limited (‘JPMF’ or the ‘Manager’ or the ‘Investment Manager’) as its Alternative
Investment Fund Manager. JPMF delegates the management of the Company’s portfolio to JPMorgan Asset Management (UK)
Limited (‘JPMAM’).
Association of Investment Companies (‘AIC’)
The Company is a member of the AIC.
Website
More information about the Company can be found online at www.jpmeuropeandiscovery.co.uk.
FINANCIAL CALENDAR
Financial year end 31st March
Final results announced June
Half year end 30th September
Half year results announced December
Annual General Meeting July
European Discovery AR 4pp cover.qxp 20/06/2024 09:47 Page 2

Contents
J.P. Morgan Asset Management 3
Strategic Report
Financial Highlights 5
Chairman’s Statement 7
Investment Manager’s Report 11
Manager’s Investment Process 19
Portfolio Information 23
Ten Year Record 28
Environmental, Social and Governance (‘ESG’) Report 30
Business Review 33
Principal and Emerging Risks 36
Long Term Viability 39
Duty to Promote the Success of the Company — section 172 statement 40
Governance
Board of Directors 45
Directors’ Report 46
Corporate Governance Statement 49
Audit Committee Report 55
Directors’ Remuneration Report 57
Statement of Directors’ Responsibilities 60
Independent Auditor’s Report 62
Financial Statements
Statement of Comprehensive Income 69
Statement of Changes in Equity 70
Statement of Financial Position 71
Statement of Cash Flows 72
Notes to the Financial Statements 73
Regulatory Disclosures
Alternative Investment Fund Managers Directive (‘AIFMD’) Disclosure (Unaudited) 92
Securities Financing Transactions Regulation (‘SFTR’) Disclosure (Unaudited) 93
Shareholder Information
Notice of Annual General Meeting 97
Alternative Performance Measures (‘APMs’) and Glossary of Terms 101
Investing in JPMorgan European Discovery Trust plc 103
Share Fraud Warning 104
Information About the Manager 105
Information About the Company 107
European Discovery AR 01 Contents p03.qxp 20/06/2024 09:47 Page 3

Image:
Strategic Report
European Discovery AR 02 Strategic Report p04-43.qxp 20/06/2024 09:47 Page 4

Financial Highlights
J.P. Morgan Asset Management 5
Strategic Report
Total returns (including dividends reinvested)
3 years 5 years 10 years
2024 2023 Cumulative Cumulative Cumulative
Return to shareholders
1,A
Return on net assets
2,A
Benchmark return
3
Shareholder return
compared to benchmark
A
return
Net asset return
compared to
benchmark return
3,A
Dividend in respect of the year
+13.0%
–4.3% +6.8% +46.7% +127.8%
+6.8%
–3.8% +3.0% +41.0% +121.0%
+5.9%
–3.2% +6.4% +46.7% +115.2%
10.5p
9.0p
+7.1%
–1.1% +0.4%
+0.0% +12.6%
+0.9%
–0.6% –3.4%
–5.7% +5.8%
1
Source: Morningstar.
2
Source: Morningstar/J.P. Morgan using cum income net asset values per share.
3
Source: Morningstar. The Company’s benchmark is the MSCI Europe (ex UK) Small Cap Net Total Return Index in sterling terms.
A
Alternative Performance Measure (‘APM’).
A glossary of terms and APMs is provided on pages 101 and 102.
European Discovery AR 02 Strategic Report p04-43.qxp 20/06/2024 09:47 Page 5

Financial Highlights
6 JPMorgan European Discovery Trust plc – Annual Report & Financial Statements 2024
Strategic Report
Summary of results
2024 2023 % change
Total returns for the year ended 31st March
Share price total return
1,A
+13.0% –4.3%
Net asset value return
2,A
+6.8% –3.8%
Benchmark return
3
+5.9% –3.2%
Net asset value, share price, discount and market data at
31st March
Shareholders’ funds (£’000) 769,046 785,062 –2.0
Net asset value per share
A
520.7p 498.5p +4.5
4
Share price 465.5p 423.0p +10.0
5
Share price discount to net asset value per share
A
10.6% 15.1%
Shares in issue 147,692,459 157,474,931
Revenue for the year ended 31st March
Gross revenue return (£’000) 23,982 22,502 +6.6
Net revenue attributable to shareholders (£’000) 18,670 17,512 +6.6
Revenue return per share 12.04p 11.11p +8.4
Dividend per share 10.5p 9.0p +16.7
Gearing at 31st March
A
7.9% 6.9%
Ongoing charges
A
0.92% 0.94%
1
Source: Morningstar.
2
Source: Morningstar/JPMorgan, using cum income net asset value per share.
3
The Company’s benchmark is the MSCI Europe (ex UK) Small Cap Net Total Return Index in sterling terms.
4
% change, excluding dividends paid. Including dividends the return is +6.8%.
5
% change, excluding dividends paid. Including dividends the return is +13.0%.
A
Alternative Performance Measure (‘APM’).
A glossary of terms and APMs is provided on pages 101 and 102.
European Discovery AR 02 Strategic Report p04-43.qxp 20/06/2024 09:47 Page 6

Chairman’s Statement
J.P. Morgan Asset Management 7
Strategic Report
Dear Shareholder,
I am pleased to present the Company’s results for the year ended 31st March 2024.
Investment Performance
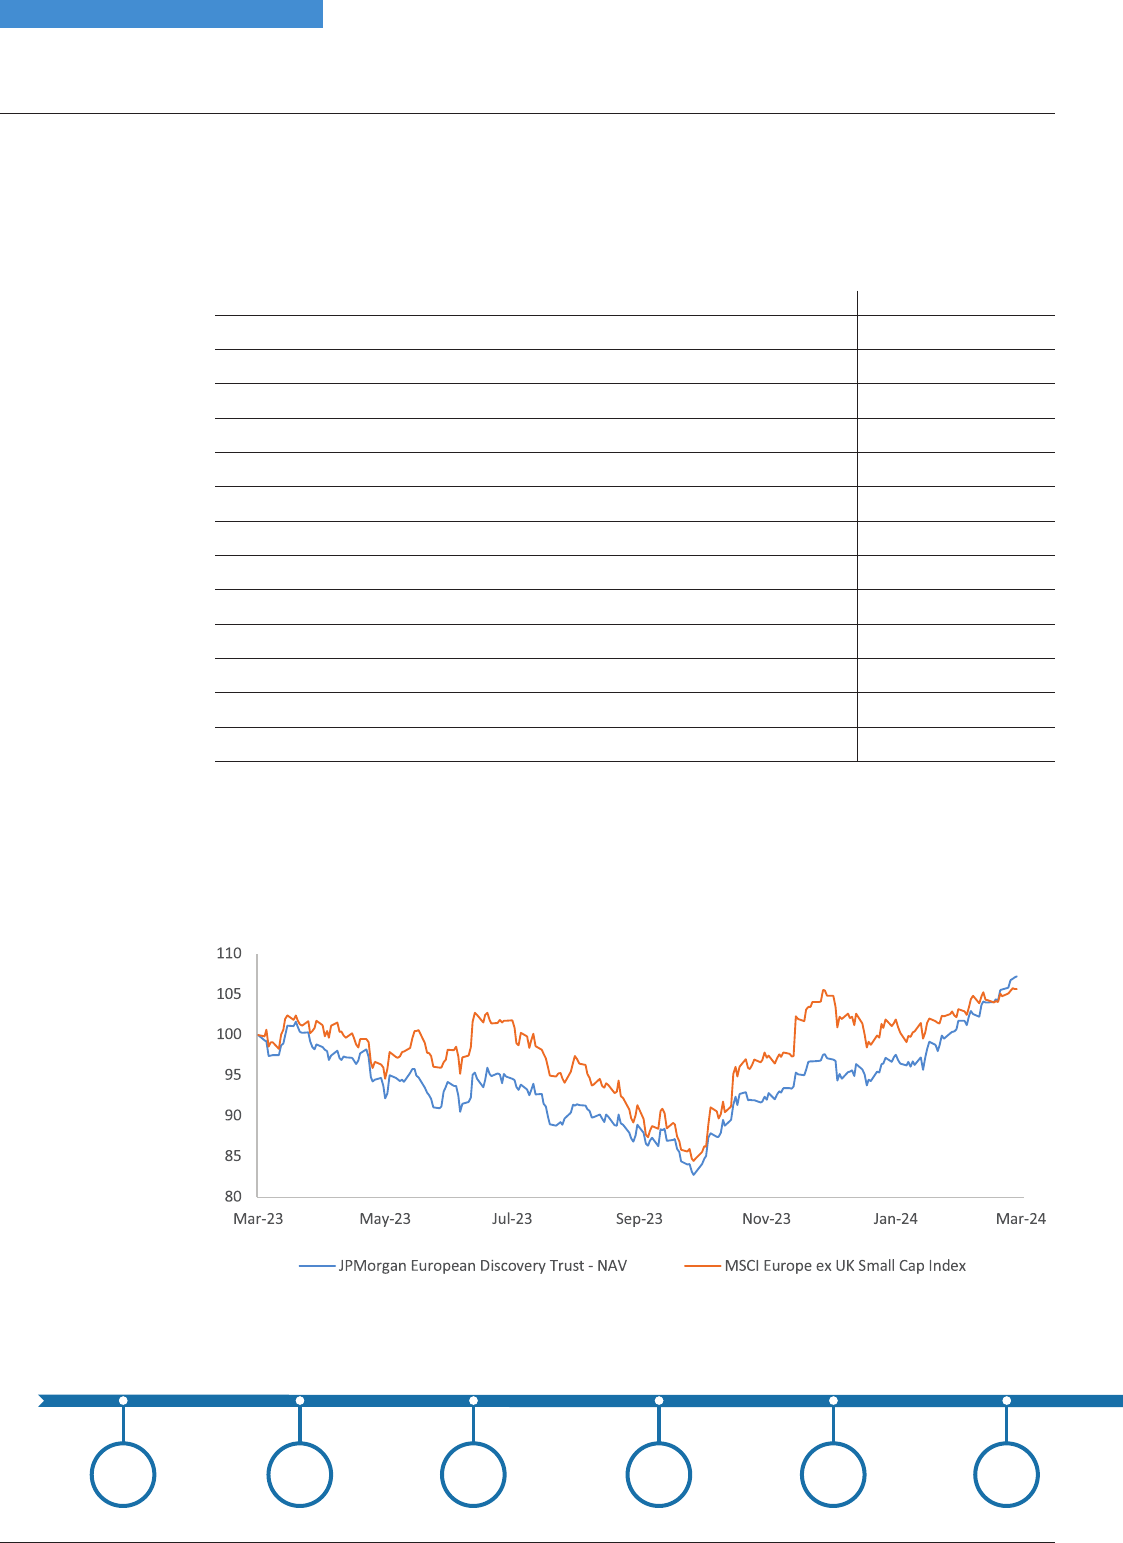
Over the year to 31st March 2024 (FY24) the total return on net assets was 6.8%, outperforming the
Company’s benchmark index, the MSCI Europe (ex UK) Small Cap Index, which returned 5.9% over the
same period. The total return to shareholders was 13.0%, as a result of a significant narrowing of the
discount at which the Company’s shares trade relative to NAV, from 15.1% to 10.6% over the year.
The explanation for this performance is in the Portfolio Managers’ report on pages 11 to 18. This also
provides a detailed commentary on portfolio positioning and the investment outlook.
Whilst the past year’s performance is pleasing, the Company adopts a long-term investment strategy,
so it is important to also consider performance over a longer timeframe. On this basis, the Company
has underperformed the market over three and five years, returning 3.0% and 41.0% respectively over
these periods, compared to benchmark returns of 6.4% and 46.7%, although its longer-term
performance remains strong in both absolute and relative terms. Over the ten years to the end of
March 2024, its total return on net assets was 121.0%, ahead of the benchmark total return of 115.2%.
Enhancements and Change
The Board has been very mindful of this mixed long-term performance. As I reported in the interim
results, over the five years to 30th September 2023 the net asset value total return was 2.0%, compared
to the benchmark total return of 20.1%. This followed a period of underperformance in the six months to
30th September 2023 of –11.4% with the Company’s benchmark returning –5.7%. The Portfolio
Managers noted in their report that the Company’s investment process tended to struggle during
periods of high volatility. During the year, they therefore implemented some important enhancements
to their process and risk management, seeking to minimise downside risk during periods of volatility
and capture upside risk when volatility reduces.
I am pleased to be able to report that these changes have had a positive impact on performance, with
the net asset value total return up 6.8% for the year to 31st March 2024, outperforming the benchmark
total return of 5.9%. A significant amount of performance came in the last six months of the financial
year, with the net asset value total return up 20.5% against the benchmark return of 12.4%.
As announced earlier this year, in light of the Company’s longer-term performance, the Board of
Directors and J.P. Morgan Asset Management (‘JPMAM’) undertook an internal review of the portfolio
management team and its investment process. This led to Jon Ingram, Jack Featherby and
JulesBloch being appointed as named Portfolio Managers of the Company with effect from 1st March
2024, replacing Francesco Conte and Edward Greaves. The Board is delighted to welcome Jon, Jack
and Jules and looks forward to working with the new investment team to deliver strong, long-term
returns for all shareholders. Since 1st March, the new Portfolio Managers have continued to refine the
investment process; the changes they have made are set out in their Report starting on page 11.
Francesco Conte is retiring and the Board and I would like to take this opportunity to recognise his
immense contribution to the Company for over the 25 years since he has been at the helm. Since 1998
the fundhas provided a share price total return of some 1,666% through several market cycles and
shocks. We would like to thank him for his commitment and efforts during this period, as well as to
EdwardGreaves who has been a named Portfolio Manager since 2016.
Gearing
Gearing can be a differentiator for an investment trust, and the Board believes that it can be beneficial
to performance. The Board sets the overall strategic gearing policy and guidelines, and reviews these
at each Board meeting. During the year, the revolving credit facility with Scotia Bank (EUR125m)
expired. This facility was renewed for a further two-year term. During the year gearing varied between
10.0% geared and 0.5% cash. At the end of the financial year, gearing stood at 7.9%.
Marc van Gelder
Chairman
European Discovery AR 02 Strategic Report p04-43.qxp 20/06/2024 09:47 Page 7

Chairman’s Statement
8 JPMorgan European Discovery Trust plc – Annual Report & Financial Statements 2024
Strategic Report
Revenue and Dividends
The Board’s dividend policy is to pay out the majority of revenue available each year to its
shareholders. This is set against the Company’s objective of maximising capital growth, and the
Portfolio Managers are therefore not constrained to deliver income in any one financial year.
An interim dividend of 2.5 pence per share was paid on 5th February 2024, higher than the previous
year’s interim dividend of 1.2 pence, reflecting the increased income received by the Company during
the first six months of the financial year, compared to the previous year. After taking into account the
income received and the level of the Company’s revenue reserves, and subject to shareholder
approval at the forthcoming Annual General Meeting, a final dividend of 8.0 pence per share will be
paid on 2nd August 2024 to shareholders on the register as at the close of business on 28th June 2024
(ex-dividend date 27th June 2024). This will take the total dividend for the year to 10.5 pence, compared
to a total dividend of 9.0 pence for the previous year.
Discounts and Share Repurchases
The Company’s share price discount relative to net asset value narrowed during the Company’s
financial year, from 15.1% as at the end of March 2023 to 10.6% as at 31st March 2024. The average
discount over the period was 13.0%. As at 14th June 2024, the discount was 10.76%. The Board
continues to monitor the level of the discount carefully and seeks to use its ability to repurchase
shares to minimise the short-term volatility and the absolute level of the discount when appropriate.
During the year, the Company repurchased 9,782,472 shares at an average discount of 11.8%.
Manager Evaluation
During the year, the Management Engagement Committee undertook a formal review of the Manager,
facilitated by an independent board evaluation firm. The review covered the investment management,
company secretarial, administrative and marketing services provided to the Company. The review took
account of the Manager’s investment performance record, management processes, investment style,
resources and risk control mechanisms. Apart from the changes in the Portfolio Management team as
described above, the Board agreed with the Committee’s recommendation that the continued
appointment of the Manager was in the best interests of shareholders.
The Board
Nicholas Smith will be retiring from the Board at the end of the forthcoming Annual General Meeting
(‘AGM’), having served as aDirector since 2015. The Board would like to thank Nicholas for his
significant contribution to the Company during his tenure as Audit Chair and Senior Independent
Director and wish him well for the future.
Sarah Watters took over the role of the Senior Independent Director of the Company during the year
and Arun Sarwal will succeed Nicholas as Audit Chair following the AGM.
In anticipation of Nicholas’s impending retirement, the Board initiated a search earlier this year to
identify a new Director. As announced on 13th June 2024, James Will has been appointed as an
independent non-executive director with effect from the conclusion of the 2024 AGM. James has
extensive investment company experience and my fellow Board members and I look forward to
working with him.
Environmental, Social and Governance (‘ESG’)
The Board shares the Investment Manager’s view of the significance of financially material
environmental, social and governance (‘ESG’) factors when making long term investments. The
Portfolio Managers regularly discuss financially material ESG issues with the management teams of
potential and current investee companies on an ongoing basis. Further information on the Manager’s
ESG process and engagement is set out in the ESG Report on pages 30 to 32.
Shareholder Engagement
The Board believes that shareholder interactions are very helpful in assisting it with the management
of the Company’s affairs. Over the course of the year, we have engaged with a number of our largest
shareholders to listen to their thoughts and views. The Board values the feedback it has received and
European Discovery AR 02 Strategic Report p04-43.qxp 20/06/2024 09:47 Page 8

Chairman’s Statement
J.P. Morgan Asset Management 9
Strategic Report
insights it has gained through the engagement process and we thank the shareholders for their
support.
We remain committed to continued engagement over the coming year; in particular, Board members
welcome and seek such meetings as and when such opportunities arise.
During the year, the Board also undertook an Asset Reunification Programme, conducted by the
Company’s registrar, which ultimately traced and reunited shareholders with unclaimed shares and
dividends in the Company valued at approximately £230,000. More details can be found on page 43.
Tender Offer
Following a consultation with a number of the Company’s largest shareholders, the Board has
decided to undertake atender offer for up to 15% of the issued share capital (excluding shares held in
Treasury) of the Company (the ‘Tender Offer’). The Tender Offer, which is subject to shareholder
approval, will be made at a tender price equal to a 2% discount to the prevailing net asset value per
share as at the calculation date, less the costs of implementing the Tender Offer.
In addition, the Board intends to introduce a performance related tender offer for up to 15% of the
issued share capital (excluding shares held in Treasury) of the Company (the ‘Conditional Tender
Offer’). If the Company’s net asset value total return does not equal or exceed the benchmark total
return (MSCI Europe ex UK Small Cap Index (net)) over the five-year period beginning 1st April 2024 and
ending on 31st March 2029. The Conditional Tender Offer will be held as soon as practicable following
the conclusion of the 2029 Annual General Meeting. The Conditional Tender Offer, which is subject to
shareholder approval, will be made at atender price equal to a 2% discount to the prevailing net asset
value per share as at the calculation date, less the costs of implementing the Conditional Tender Offer.
Further announcements in relation to the Tender Offer and Conditional Tender Offer will be made
following the conclusion of the Company’s upcoming Annual General Meeting.
Annual General Meeting
The Company’s Annual General Meeting will be held on Wednesday, 24th July 2024 at 12.30 p.m. at
60Victoria Embankment, London EC4Y 0JP.
The Portfolio Managers’ will give a presentation to shareholders, reviewing the past year and
commenting on the outlook for the current year. The meeting will be followed by lunch, providing
shareholders with the opportunity to meet the Directors and representatives of the Manager. We look
forward to seeing as many shareholders as possible at the AGM.
For shareholders wishing to follow the AGM proceedings but choosing not to attend in person, we will
be able to welcome you through conferencing software. Details on how to register, together with
access details, will be available shortly on the Company’s website:
www.jpmorganeuropeandiscovery.co.uk
, or by contacting the Company Secretary at
invtrusts.cosec@jpmorgan.com
.
As is normal practice, all voting on the resolutions will be conducted by a poll. Due to technological
reasons, shareholders viewing the meeting via conferencing software will not be able to vote on the
poll and we therefore encourage all shareholders, and particularly those who cannot attend in person,
to exercise their votes in advance of the meeting by completing and submitting their form of proxy.
If you have any detailed or technical questions, it would be helpful if you could raise them in advance
with the Company Secretary at 60 Victoria Embankment, London EC4Y 0JP or via the ‘Ask a Question’
link on the Company’s website. Shareholders who are unable to attend the AGM are encouraged to
use their proxy votes.
If there are any changes to the arrangements for the Annual General Meeting, the Company will
update shareholders through the Company’s website and, if appropriate, through an announcement
on the London Stock Exchange.
European Discovery AR 02 Strategic Report p04-43.qxp 20/06/2024 09:47 Page 9

Chairman’s Statement
10 JPMorgan European Discovery Trust plc – Annual Report & Financial Statements 2024
Strategic Report
Stay Informed
The Company delivers email updates with regular news and views, as well as the latest performance. If
you have not already signed up to receive these communications and you wish to do so, you can opt in
via https://web.gim.jpmorgan.com/emea_investment_trust_subscription/welcome?targetFund=JEDT
or by scanning the QR code on this page.
Outlook
The outlook for European small cap companies seems considerably brighter than when I wrote my
last statement to shareholders for the Half Year Report six months ago. Since then, economic and
financial conditions have improved, and real wage increases should give the recovery further
momentum. It seems very likely that the European Central Bank (‘ECB’) will cut interest rates at least
acouple of times this year which will further improve economic conditions in the region.
These positive developments have already had a favourable impact on investor sentiment. European
small and mid-cap companies tend to outperform as the broader market rallies and based on history
your Company’s carefully selected, high quality, investments should do even better in such markets.
Looking further ahead, as you will read in the Portfolio Managers’ report, the innovative, nimble
businesses that germinate in the small cap and mid cap space are positioned to benefit significantly
from the emerging trends we are seeing, such as the Artificial Intelligence (AI) and research in certain
areas in pharmaceuticals.
These macro and structural developments all bode well for the sector and your Company. Together
with a new investment team and the ongoing support of JPMorgan’s extensive research resources,
the Board is confident that the Company is well positioned to make the most of this supportive
environment to deliver strong results to shareholders over the rest of 2024 and beyond.
Marc van Gelder
Chairman 19th June 2024
European Discovery AR 02 Strategic Report p04-43.qxp 20/06/2024 09:47 Page 10

Investment Manager’s Report
J.P. Morgan Asset Management 11
Strategic Report
This year was a major one for the Company as the decision was made in February to transition the
investment management team to a new team consisting of Jon Ingram, Jack Featherby and
JulesBloch – three experienced portfolio managers with a collective history of 40 years of investing in
European Small Caps.
Through this time, especially following a period of tough absolute and relative performance, we
appreciate the continued support of all our shareholders. We believe that the change in management
team, alongside the continued commitment to the existing investment process, should be positive for
our shareholders. As we, the new managers, step in, we would like to thank both Francesco Conte and
Edward Greaves for their many years of stewardship and we wish them well going forward.
As to the Company, we are very excited about the current investment opportunity in European Small
Caps. Itis an asset class with a fantastic long-term track record. As we write in our outlook below, we
firmly believe that the current set up of the asset class, one supported by multiple tailwinds, align the
Company in a good position to deliver strong returns for you, our shareholders.
Review
The financial year ended 31st March 2024 was marked by dramatic shifts in investor sentiment and
market performance. At the start of the period, global markets were still reverberating from the
collapse of Silicon Valley Bank (SVB) and Credit Suisse in March 2023.
As concerns around a banking crisis receded, markets were swayed by inflation figures and the
corresponding reactions of central banks. As the year progressed, investors welcomed confirmation
that inflation rates were falling. Nonetheless, central banks continued to raise rates, motivated by
concerns that inflation would otherwise become entrenched.
There was almost universal consensus amongst forecasters that Europe was heading into recession,
induced by the compounding effects of a regional energy crisis, Russia’s invasion of Ukraine,
double-digit inflation and monetary tightening that pushed interest rates to their highest level in well
over adecade.
This recession failed to materialise, but these macroeconomic fears still had a significant impact on
European Small Cap stocks which are typically more levered to the economic performance of their
national home markets.
Inflation rates around the world cooled as the year progressed, and central bankers started to
recognise the progress made on the inflation front. In late October 2023, Federal Reserve Chairman
Powell adopted a more dovish stance, marking a significant turning point in investor sentiment.
Global equity markets began a recovery that continued through to the end of the review period.
Though European smaller companies did benefit from the improvement in market sentiment in the
second half of 2023, they have now underperformed European large companies by more than 25%
since September 2021. This is the longest and sharpest period of underperformance in the past
20years. These periods have historically been followed by strong outperformance of European
smaller companies.
Table 1: Periods of European Small Cap underperformance and the corresponding
performance rebound
Under- 5Y forward
Period Number of months performance outperformance
September 2021 – March 2024 30 –29% Still within period
March 2007 – December 2008 22 –15% 95%
March 2018 – September 2019 19 –10% Still within period
January 2011 – December 2011 12 –10% 53%
March 2014 – October 2014 8 –7% 19%
Source: J.P. Morgan Asset Management, Bloomberg. Large Caps: MSCI Europe, Small Caps: MSCI Europe Small Caps.
Jon Ingram
Investment Manager
Jack Featherby
Investment Manager
Jules Bloch
Investment Manager
Portfolio Performance
Despite the volatility induced by macroeconomic factors, the Net Asset Value of the Company
increased by 6.8% during the year, outperforming the benchmark by 0.9%.
Performance attribution
Year ended 31st March 2024
% %
Contributions to total returns
Benchmark return +5.9%
Asset allocation –1.6%
Stock selection 1.5%
Gearing/cash effect 1.1%
Currency effect 0.1%
Investment Managers’ added contribution 1.1%
Portfolio return 7.0%
Management fees/other expenses –0.9%
Share Buy-Back 0.7%
Other effects –0.2%
Return on net assets
A
6.8%
Return to shareholders
A
13.0%
Source: JPMAM/Morningstar.
All figures are on a total return basis.
Performance attribution analyses how the Company achieved its recorded performance relative to its benchmark.
A
Alternative Performance Measure (‘APM’).
A glossary of terms and APMs is provided on pages 101 and 102.
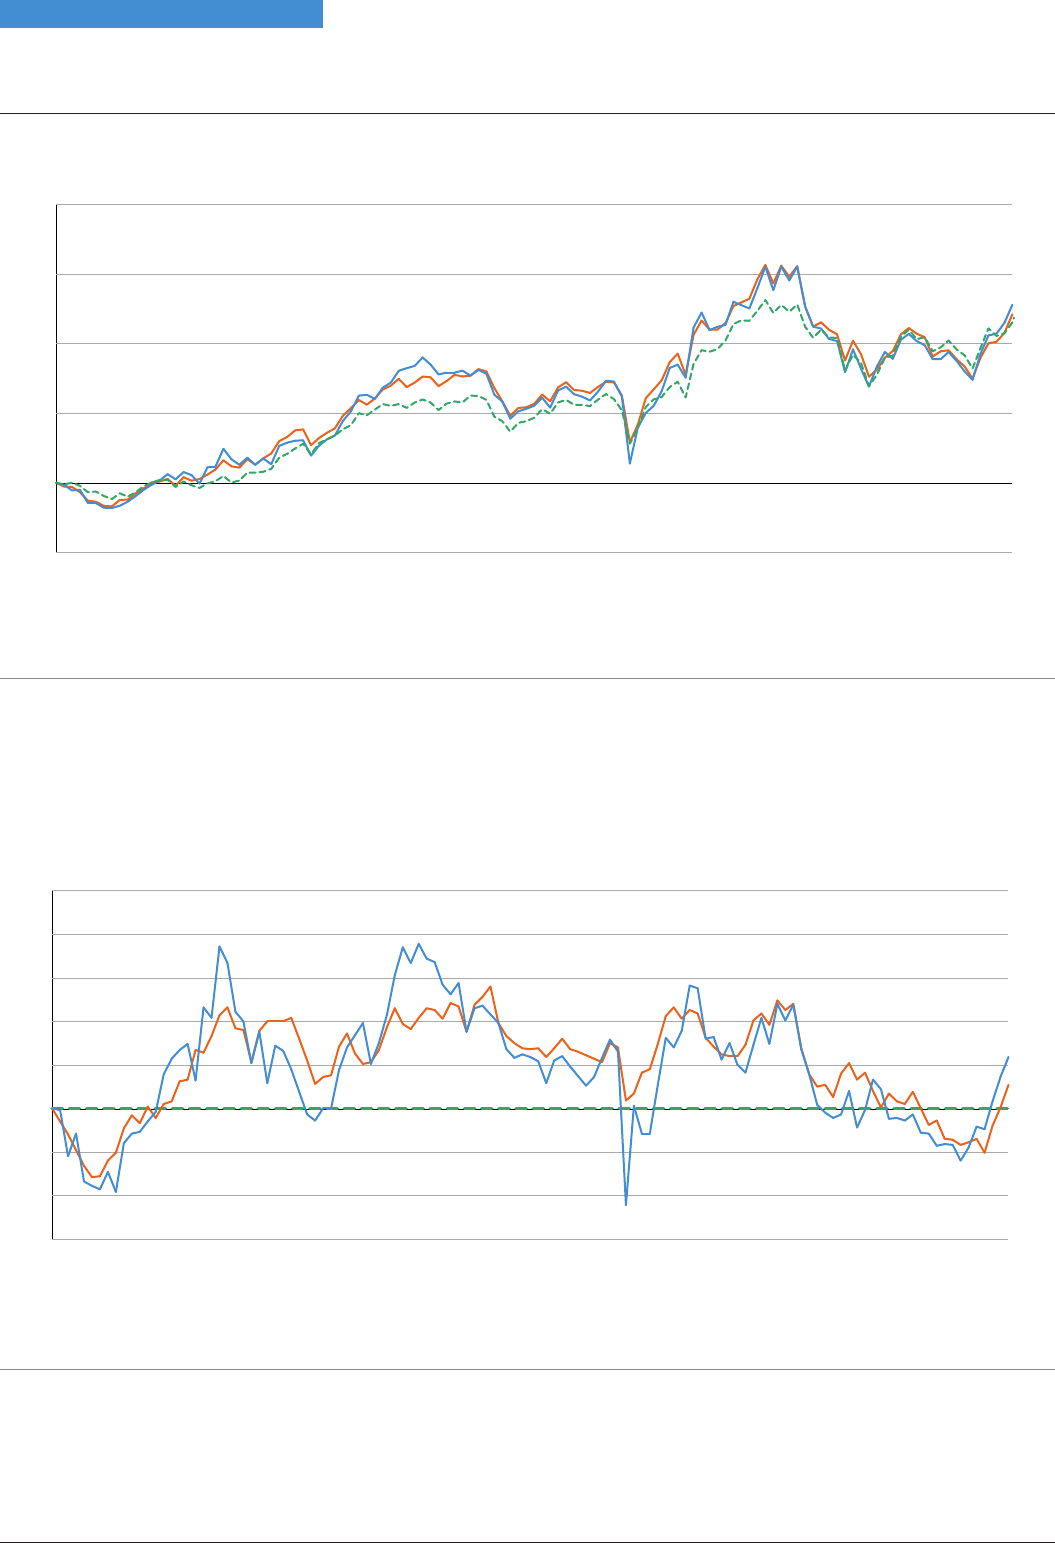
Chart 1: Performance of JPMorgan European Discovery Trust versus MSCI Europe ex UK -Small
Cap Index benchmark
Source: Bloomberg
Investment Manager’s Report
12 JPMorgan European Discovery Trust plc – Annual Report & Financial Statements 2024
Strategic Report
1987
dot com boom
2000
Euro
introduced
2002
Global banking
crisis
2008
Formation of
the Company
1987
Fall of
Berlin Wall
1989
European
single market
created
1993
European Discovery AR 02 Strategic Report p04-43.qxp 20/06/2024 09:47 Page 12

Investment Manager’s Report
J.P. Morgan Asset Management 13
Strategic Report
The relative performance of the Company has been volatile during the year. Performance was
adversely impacted in periods where macroeconomic themes dominated. For instance, the portfolio
underperformed in the last quarter of 2023, when expectations of significant interest rate cuts fuelled
a substantial rally in low-quality and high-risk companies.
However, since the start of 2024, company fundamentals have become the main driver of share price
performance again. In the first three months of 2024, the NAV increased 10.4% compared to 2.1% for
the MSCI Europe ex-UK Small Cap index.
Sector contribution
Table 2: Sector performance – Top 3 and Bottom 3 sectors contributing to performance
Account (%) Benchmark (%) Attribution (%)
Group Avg Wgt Return Avg Wgt Return Selection Allocation Total
Communication
Services 6.28 21.78 4.77 8.67 0.84 0.03 0.87
Materials 5.17 7.32 7.91 –4.08 0.51 0.20 0.71
Financials 14.01 35.30 13.92 26.16 0.88 –0.22 0.67
Utilities 0.82 –4.28 2.78 3.18 –0.25 –0.04 –0.29
Consumer
Discretionary 17.42 0.23 8.22 0.41 –0.03 –0.76 –0.79
Information
Technology 12.70 –13.25 10.48 -6.29 –1.30 –0.01 –1.31
Source: J.P. Morgan Asset Management.
Our overweight to Communication Services contributed positively to performance during the year. Our
large overweight in CTS Eventim, the German online ticketing platform, delivered strong performance;
the cost of live entertainment skyrocketed in 2023 due to increased demand as consumers returned
to the experiences they missed out on during the pandemic. Ticketing platforms benefitted from this
‘revenge spending’ which shows no sign of abating.
The positive attribution from Materials is the result of our underweight to companies that have been
hurt by energy prices, have structurally low returns on invested capital or were delivering earnings
that we thought were not maintainable. Our focus on defensive companies with strong balance sheets
and high cash flow conversion allowed us to outperform the sector. This includes the German
producer of industrial lubricants Fuchs Petrolub, which has a robust medium-term volume growth
potential because of recent capacity investments, while the deflation in base oils is a tailwind to its
margins and cash flows.
Despite the volatility induced by the collapse of SVB and Credit Suisse at the start of the period, the
Financial sector was one of the largest contributors to returns at the sectoral level. After it became
clear that these bank failures were isolated events, this undervalued sector stabilised and reaped the
benefits from high interest rates and low bankruptcy rates. Our investment in BPER Banca, the Italian
banking group, performed particularly strongly for these reasons.
The largest sectoral detractor from performance was the portfolio’s stock selection in Information
Technology. Our exposure to automotive semiconductor companies such as Melexis and Elmos
suffered from the sharp slowdown in the electric vehicle market and fears of a broad-based
2024
EU referendum
vote
June
2016
Synchronised
global economic
recovery
2017
Euro
crisis
2012
Escalating trade
tensions between
US and China
2018/
2019
COVID-19
outbreak
Early
2020
Vaccine programme
roll-out
2021
Russia-Ukraine
War
2022
European Discovery AR 02 Strategic Report p04-43.qxp 20/06/2024 09:47 Page 13

destocking from automotive OEMs. Our overweight to IT consulting companies such as Alten, Reply
and Tietoevry also contributed negatively as clients postponed some IT and innovation projects due to
macroeconomic uncertainty.
The portfolio’s overweight to Consumer Discretionary also contributed negatively. Elevated rates of
inflation and increasing interest rates eroded consumer confidence in 2023. Our overweight to auto
suppliers such as Forvia and Plastic Omnium contributed negatively as they were hit by significant
cost inflation, leaving their levered balance sheets under pressure. Other companies related to
construction such as JM (a Swedish housing developer) or Ariston (an Italian manufacturer of heating
solutions) also suffered from the impact of tightening monetary policies.
Stock contribution
Table 3: Investment performance – Top 3 and Bottom 3 investments contributing to performance
Account (%) Benchmark (%)
Security Name Avg Wgt Return Avg Wgt Return Wgt Diff Total Effect
Top 3 Contributors
SPIE 3.45 30.07 0.49 29.28 2.96 0.71
Arcadis 2.18 48.14 0.39 48.56 1.78 0.57
CTS Eventim 2.49 41.69 0.47 41.46 2.02 0.56
Bottom 3 Contributors
Bravida 2.26 –21.71 0.20 –22.25 2.06 –0.85
Melexis 1.90 –28.42 0.21 –29.25 1.69 –0.78
Forvia 0.81 –44.14 0.37 –31.44 0.44 –0.76
Source: J.P. Morgan Asset Management.
During the year our biggest contributors to performance at the stock level were: SPIE, the French
technical services company, as demand for installation of electrical systems was boosted by the
ongoing energy transition towards electrification; Arcadis, the Dutch engineering and architecture
services company, which has benefitted from strong infrastructure investments in the US and in
Europe; and CTS Eventim, as demand for live events continued to grow significantly post-COVID.
The biggest detractors to performance were Bravida, the Swedish multi-technical services company,
as the sharp slowdown in Swedish residential construction led to significant pricing pressure for
installers; Melexis, the Belgian manufacturer of automotive chips, as automotive manufacturers who
over-ordered chips due to post-COVID supply chain constraints now have to reduce their inventories
in a slowing demand environment; and Forvia, the French automotive supplier, as the company did
not manage to increase prices enough, while increasing interest rates put pressure on a stretched
balance sheet.
Portfolio Changes
During the review period, we aimed to position the Company to take best advantage of the
opportunities available.
We acquired several Healthcare companies with strong innovation pipelines, thereby increasing our
allocation to the Healthcare sector. These included Zealand Pharma, a Danish biotech company with
interesting weight-loss assets. We believe the development of anti-obesity drugs has become a key
structural driver of the Healthcare sector, and Zealand Pharma offers exposure via its long-acting
Investment Manager’s Report
14 JPMorgan European Discovery Trust plc – Annual Report & Financial Statements 2024
Strategic Report
European Discovery AR 02 Strategic Report p04-43.qxp 20/06/2024 09:47 Page 14

Investment Manager’s Report
J.P. Morgan Asset Management 15
Strategic Report
amylin petrelintide. This drug could have a better tolerability profile than existing weight-loss drugs,
and thus offer a superior patient experience. We also purchased Bonesupport, a Swedish
biotechnology company with a unique and innovative bone graft technology platform which is
perceived as vastly superior to current standards of care, with lower deep infection rates and a higher
rate of bone union. Bonesupport’s offering is now approved for various applications, which will allow
the company to grow very rapidly.
We also identified several attractive investment opportunities in the Energy sector. After years of
underinvestment in energy infrastructure, recent changes in the geopolitical landscape are reshaping
energy supply chains. This has been positive for European companies in the sector, which still trade at
attractive valuations. One such company is Vallourec, a French producer of premium pipes for oil &
gas drilling and distribution. In the past 18 months, a new management team has cut debt, closed
loss-making operations across Europe, and re-focused commercial efforts on high-margin
applications. As a result, Vallourec is now a profitable and cash-flow generative business, trading at
an appealing valuation. We also purchased GTT, a French engineering company specialising in the
design of cryogenic membrane containment systems for liquid natural gas (LNG) shipping and
storage. LNG’s share of the world’s energy consumption is increasing as the world strives to cut its
dependence on energy sources with higher carbon emissions. The war in Ukraine has accelerated
investments in liquefaction and LNG transportation, which materially improved GTT’s growth
prospects.
Real Estate is the other area to which we increased exposure. With inflation under control, and interest
rates set to decline, we expect real estate companies with strong balance sheets to start trading
closer to the net asset value (NAV) of their underlying assets. We purchased TAG Immobilien,
aGerman residential company. TAG’s stock trades at a significant discount to NAV despite a low-risk
leverage ratio, high occupancy rates, increasing rents and an attractive growth pipeline in the Polish
market. We also bought Merlin Properties, which owns diversified real estate assets in Spain. Merlin
has a strong balance sheet and will use its financial firepower to invest in data centres, which are
expected to see sustained demand from the rapidly rising appetite for data processing and storage.
We expect this growth to be value accretive for Merlin, but the stock still trades at a significant
discount to the portfolio’s NAV.
To fund these purchases, we reduced overweights to IT and Industrials. Within the Technology sector,
we adopted a more cautious stance on automotive semiconductors. In the post-pandemic recovery,
automotive component companies struggled to source chips due to supply chain disruptions. This
benefited chip manufacturers, as availability became more important than price. However, automotive
component makers now have adequate levels of chip inventories and demand for electric vehicles is
slowing. The earnings growth prospects for automotive chip manufacturers are therefore less
attractive and we have reduced exposure accordingly. We sold Elmos Semiconductors and Melexis
due to their deteriorating operating momentum.
Within Industrials, we reduced our exposure to companies with high exposure to construction; activity
in the sector has suffered due to the rapid rise in interest rates. Building permits in Germany are down
almost 50% from the peak levels of 2021. During the year, we sold industrial companies such as Georg
Fischer (which produces piping systems), Ariston (a supplier of heating systems), Aalberts (which
makes flow control devices) and AFRY (an architectural services company). Other names in the
Industrial sector such as Prysmian, Trelleborg and d’Ieteren were sold because they left our
investment universe following strong performance.
European Discovery AR 02 Strategic Report p04-43.qxp 20/06/2024 09:47 Page 15
Investment Manager’s Report
16 JPMorgan European Discovery Trust plc – Annual Report & Financial Statements 2024
Strategic Report
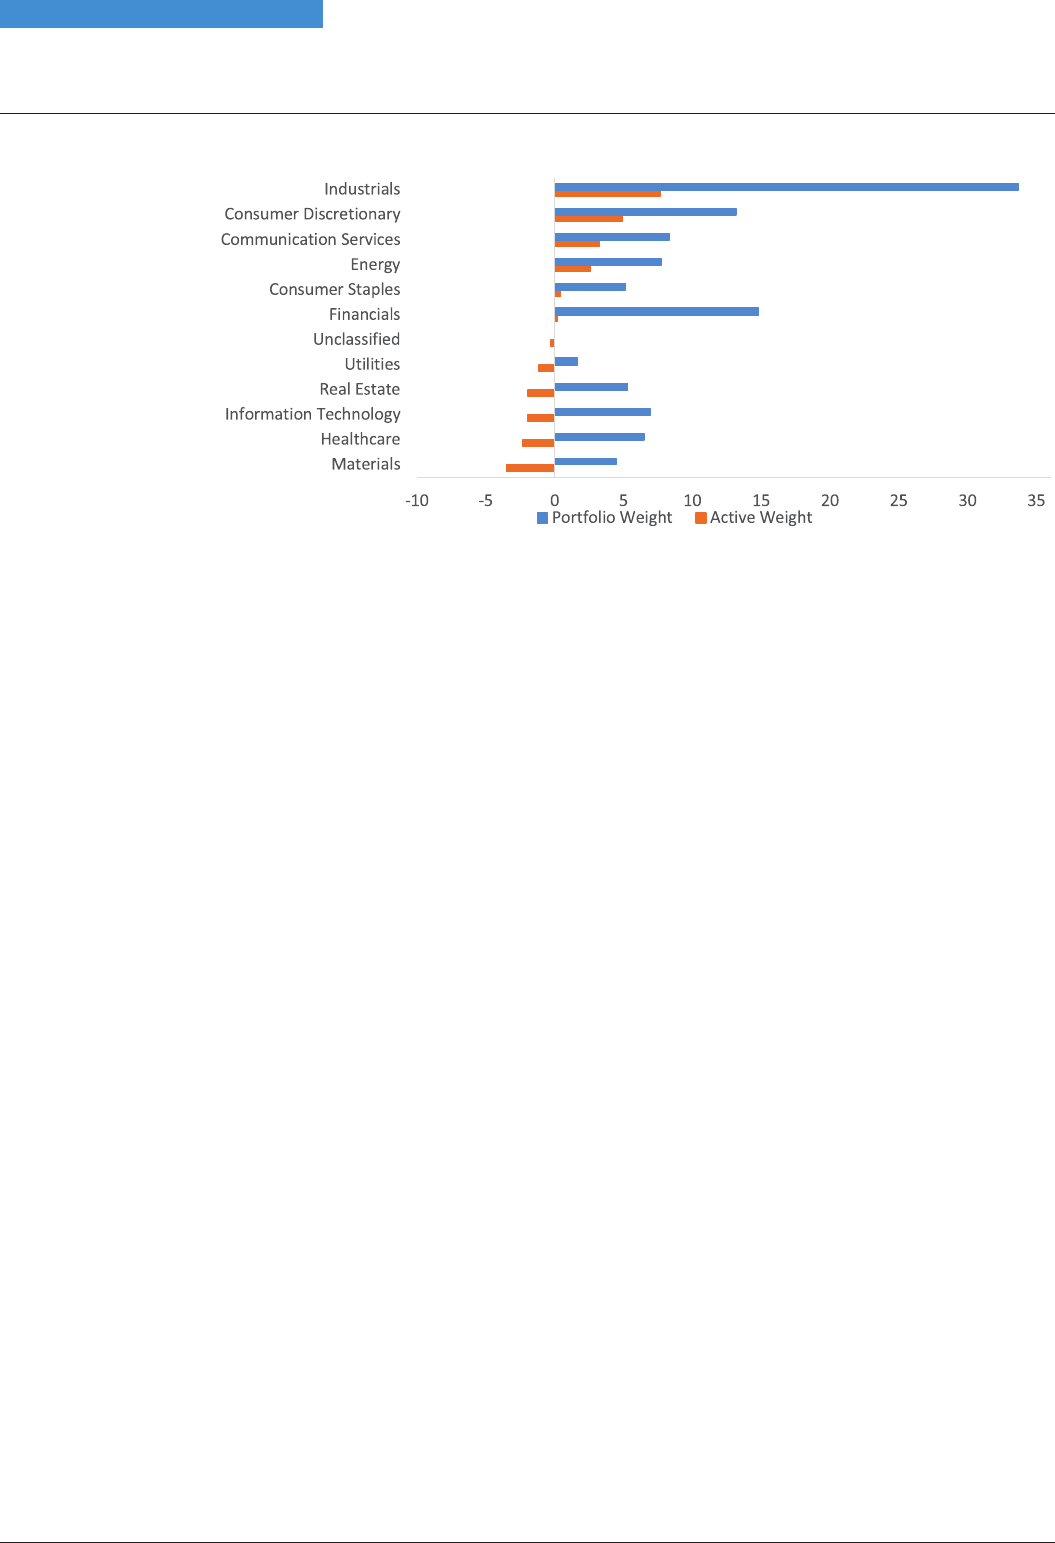
Chart 2: Current Portfolio Positioning
Source: J.P. Morgan Asset Management.
Despite the disposal of these companies, Industrials remain the portfolio’s most significant
overweight. Any recovery in manufacturing activity would provide a tailwind for many of the industrial
companies we own, but our holdings have company-specific drivers that should help them perform
regardless of the economic environment. Do&Co for example is an Austrian airline catering company
taking market share from struggling peers thanks to its unique ‘premium fresh cuisine’ branding. An
economic slowdown is unlikely to slow the pace at which the company opens new locations and signs
new airlines. Another holding, Bilfinger, is a German industrial services company whose new
management is implementing better risk controls and pricing mechanisms, which should
significantly increase their operating margin. Although an improvement in economic conditions
would help, the stock’s performance will depend mainly on these internal reforms.
The same is true for our overweight to Consumer Discretionary. Consumer confidence, growth in real
disposable income and the unemployment rate are all significant drivers of consumer spending. With
inflation and energy prices falling, consumer sentiment in Europe has rebounded from the lows of
September 2022. This should help the businesses we own in the sector, but their strong brands and
exposure to structurally growing categories are more significant drivers of stock performance. For
example, De’Longhi, an Italian manufacturer of home appliances, has built a solid reputation for
‘premium quality at the press of a button’ coffee machines, allowing it to benefit from the significant
growth in global coffee consumption. Sanlorenzo’s tailor-made and exclusive superyachts are
recognised for their exceptional Italian design, which makes them appealing to a growing population
of ultra-high-net-worth individuals.
Materials continues to be the portfolio’s largest sectoral underweight. Many companies in the sector
are commoditised, capital intensive, cyclical businesses, with a poor track record of shareholder value
creation. Strong post-pandemic demand and the sharp increase in energy prices after the invasion of
Ukraine significantly boosted the price of materials. However, the subsequent rapid fall in gas and
electricity prices will at some point turn into a headwind for earnings in the sector. During the year we
sold our position in Verallia, the French glassmaker. The shortage of glass in 2022 and early 2023 gave
glassmakers exceptional pricing power. We doubt these earnings will be maintainable.
Despite some sectoral over and underweights, our sector allocation is balanced relative to
benchmark, as every sector is offering attractive investment propositions. Investors’ focus on
macroeconomic variables and their implications for monetary policy has led to a raft of valuation
dislocations. Not only are small cap valuations extremely attractive compared to history, but we think
the opportunity set for alpha creation through stock-picking is also wider than usual.
European Discovery AR 02 Strategic Report p04-43.qxp 20/06/2024 09:47 Page 16
Investment Manager’s Report
J.P. Morgan Asset Management 17
Strategic Report
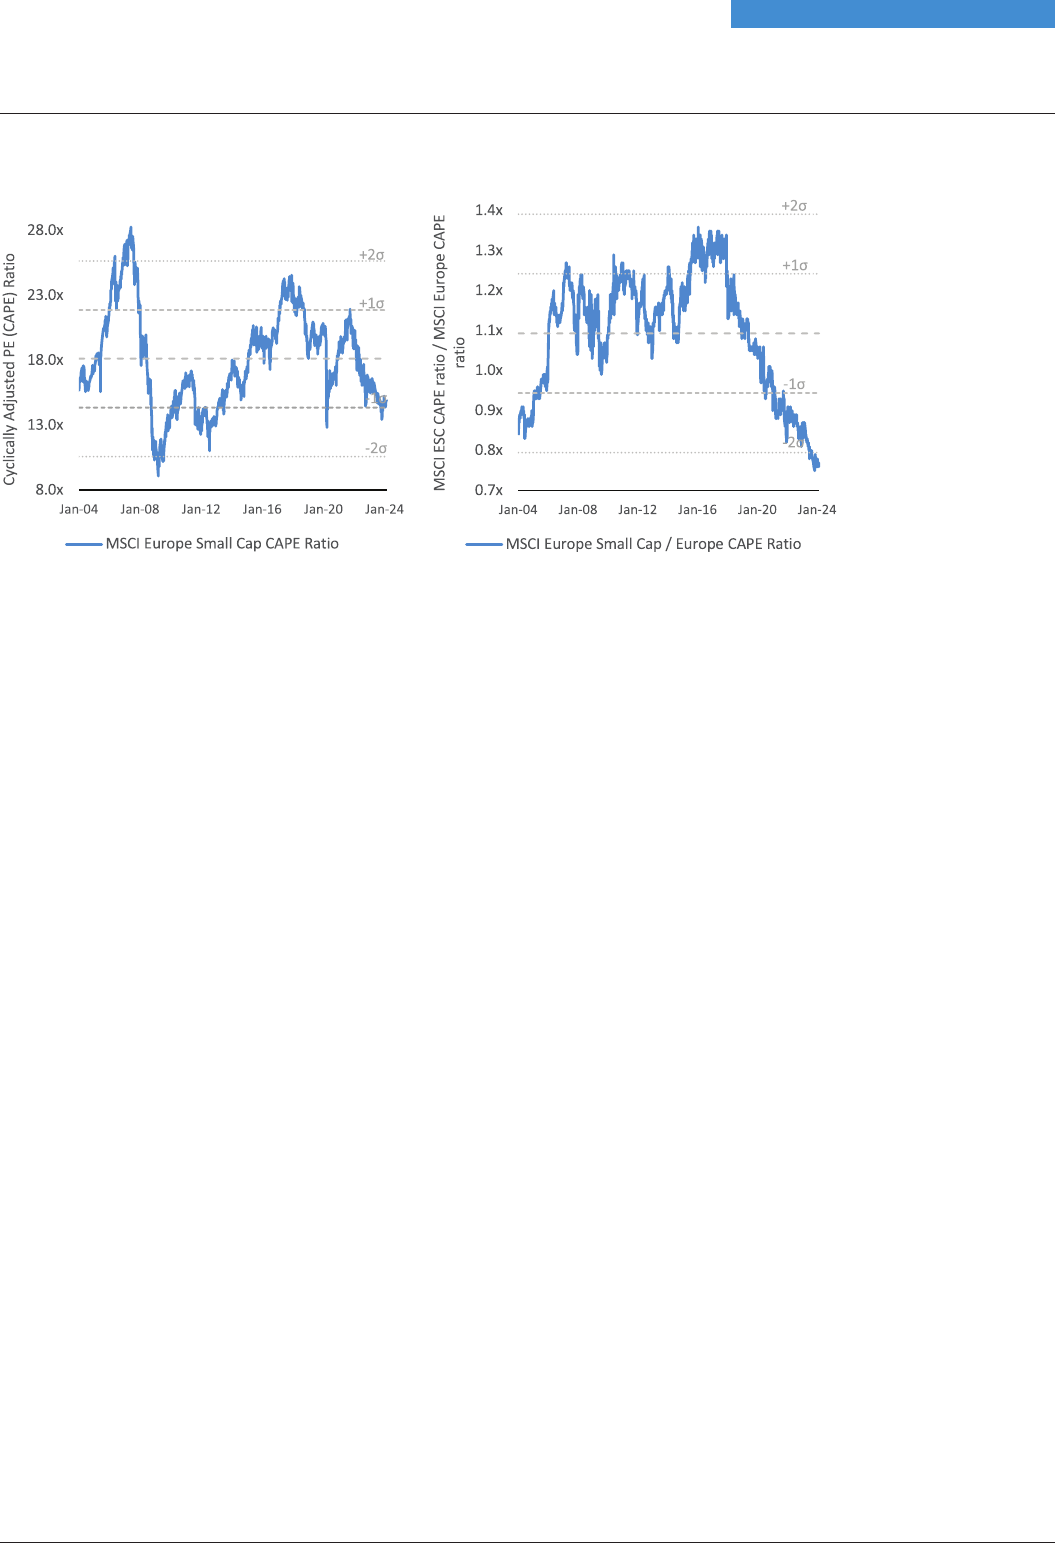
Chart 3: Small cap cyclically adjusted PE ratios, on an absolute basis (LHS) and versus large
caps (RHS)
Source: J.P. Morgan Asset Management.
Our ability to use gearing to increase market exposure has the potential to further enhance returns in
a rising market. Gearing stood at 7.9% at the end March 2024 and has since remained stable.
Outlook
Because of the attractive valuations European smaller companies currently trade at, we think the
expected return for the asset class is higher than usual. In addition, the macroeconomic headwinds
the asset class faced over recent years are now fading. The market expects the ECB to cut interest
rates during 2024 and this should boost investor sentiment, thereby benefitting small cap companies.
Furthermore, the latest data points suggest that global and European economies are more resilient
than anticipated. Indicators such as Purchasing Managers’ Index (‘PMI’) appeared to have bottomed.
And for the first time in years, major European economies are seeing growth in real wages, which
should continue to improve consumer confidence.
The asset class should receive further support from the resurgence of mergers and acquisitions
(M&A) activity. There has been a lull in deal flow within the European Small Caps space in recent years,
but attractive valuations and the prospect of lower rates could drive a marked pick-up in M&A activity.
Small cap companies are also likely to be supported over the longer-term by emerging themes such
as Artificial Intelligence (AI) and drug-assisted weight loss. To date, both these themes have mostly
played out in the mega cap space. However, the main point for small cap investors is that most of
tomorrow’s winners might be today’s small caps. For example, Amazon and ASML were small caps
back in 2000, while Tesla and Meta were not even founded.
It is our strong conviction that many of the companies which will be most successful in capitalising on
the AI revolution, pharmaceutical breakthroughs and other emergent structural trends over the
coming years are yet to be identified, or even conceived, and are thus most likely to emerge from the
small cap space.
We expect this confluence of attractive valuations, favourable macroeconomic trends, and long-term
thematic developments to act as key drivers for small caps, which have outperformed every asset
class globally over the past 25 years.
All this leaves us feeling positive about the prospects for the portfolio. In fact, in our view, the outlook
has rarely been brighter, and we expect our shareholders to benefit accordingly.
European Discovery AR 02 Strategic Report p04-43.qxp 20/06/2024 09:47 Page 17
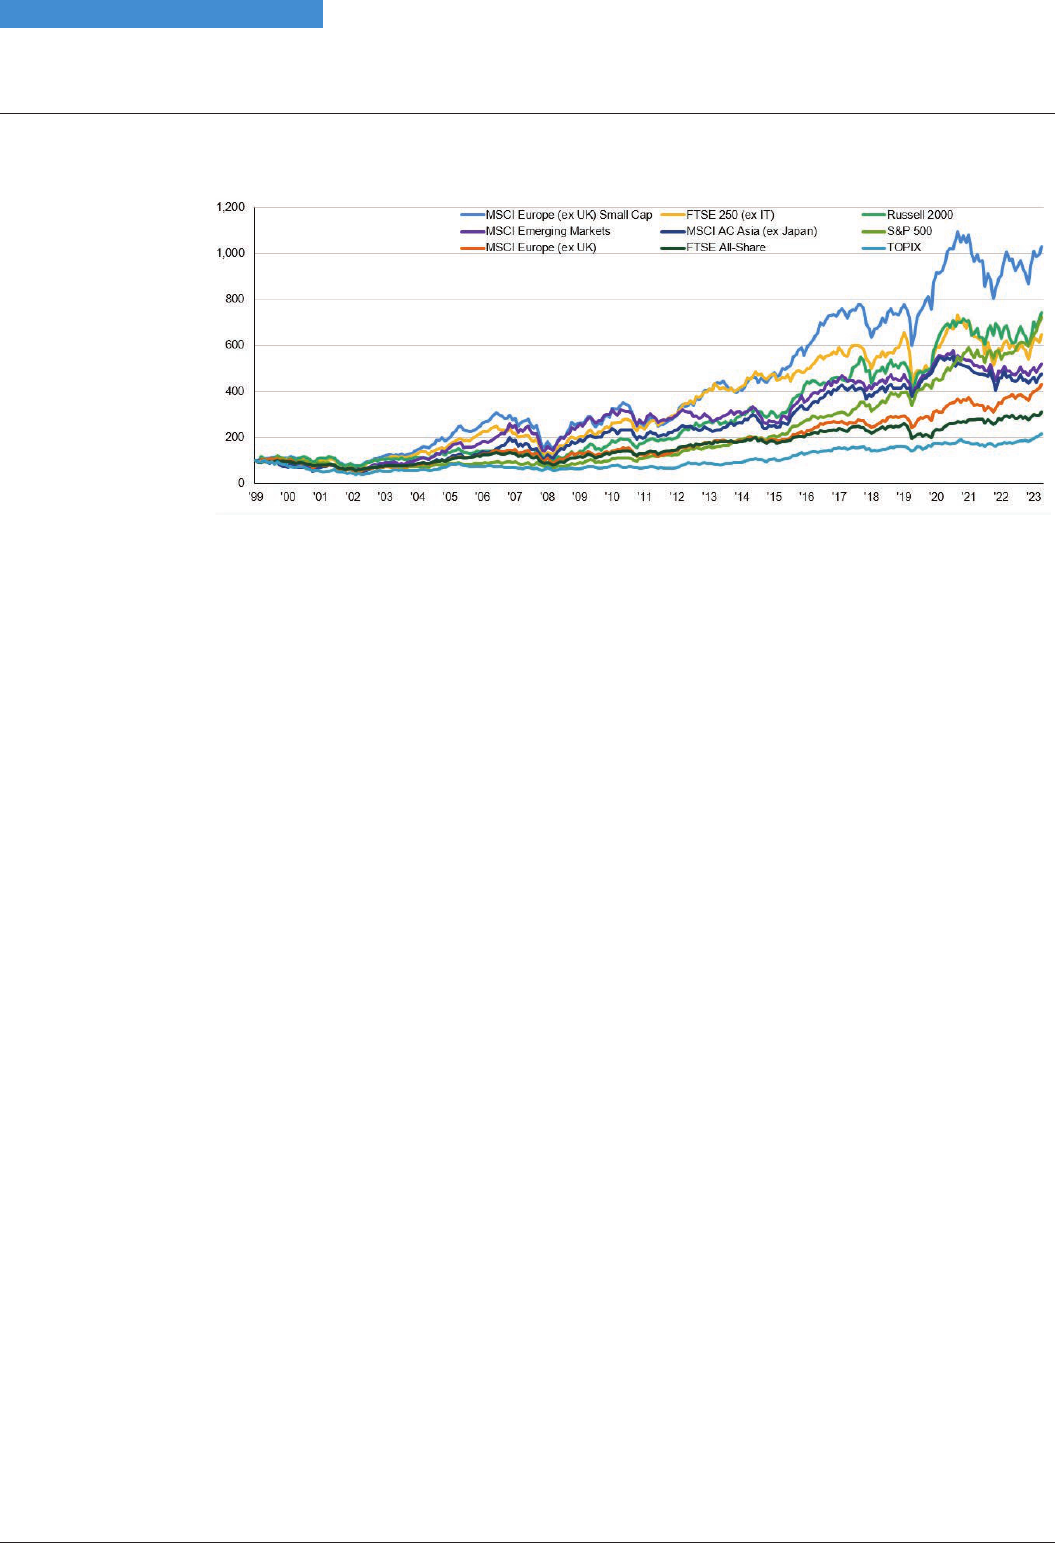
Chart 4: A compelling long term asset class
Cumulative returns
Source: J.P. Morgan Asset Management.
Jon Ingram
Jack Featherby
Jules Bloch
Investment Managers 19th June 2024
Investment Manager’s Report
18 JPMorgan European Discovery Trust plc – Annual Report & Financial Statements 2024
Strategic Report
European Discovery AR 02 Strategic Report p04-43.qxp 20/06/2024 09:47 Page 18
Manager’s Investment Process
J.P. Morgan Asset Management 19
Strategic Report
During the past year, the investment management of the Company continued to evolve to take full advantage of JPMorgan Asset
Management’s ever-growing resources. Although the Company’s fundamental investment process remains the same, there
have been several enhancements and changes which the Portfolio Managers believe will enhance their efforts to identify
attractive, but mispriced, investment opportunities across the European Small Cap space, and to deliver strong returns. These
changes continue the evolution of the Company’s Investment Process since its inception.
The following section details the Company’s Investment Process, including recent enhancements made by JPMorgan Asset
Management, such as the introduction of a decision analytics framework. This innovation is intended to improve the quality of
investment decisions and is discussed further below.
The Core Investment Objective
Through its Investment Managers, the Company aims to achieve capital growth by investing in a portfolio of smaller continental
European companies. The investment universe is defined at the time of purchase by the countries and market capitalisation
range of the constituents of the benchmark, the MSCI Europe (ex UK) Small Cap Index.
The Portfolio Managers employ a bottom-up selection process which seeks to identify Europe’s smaller ‘hidden gems’ before
they are discovered by the wider investing community (and hence the ‘Discovery’ in the Company’s name). Typically, these
companies are attractively priced, market-leading growth companies with strong quality attributes that the Portfolio Managers
expect to drive outperformance over the medium-term.
The search for hidden gems is a collaborative, team-based effort that starts with a quantitative approach to idea generation and
is complemented by fundamental research and the Portfolio Managers’ expertise. Overall risk and financially material
environmental, social and governance (ESG) considerations are integrated into each stage of the investment decision-making
process, including research, company engagement – before and after stocks enter the portfolio – and portfolio construction.
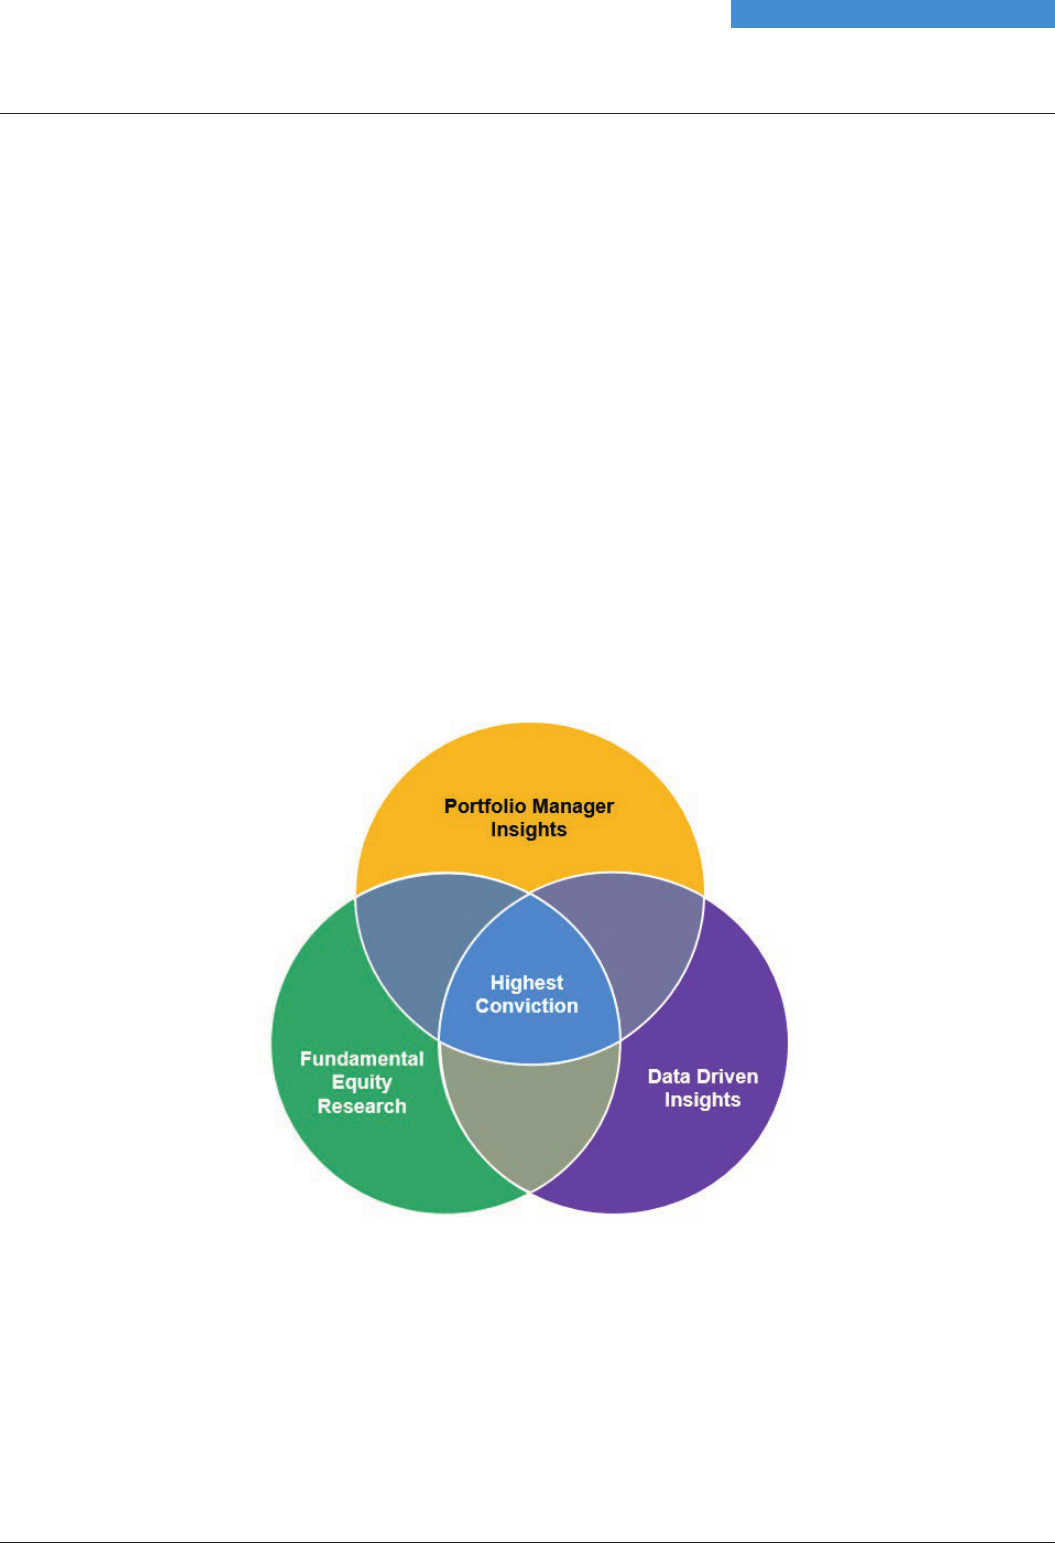
This approach results in the construction of a portfolio of high conviction stocks.
Idea Generation
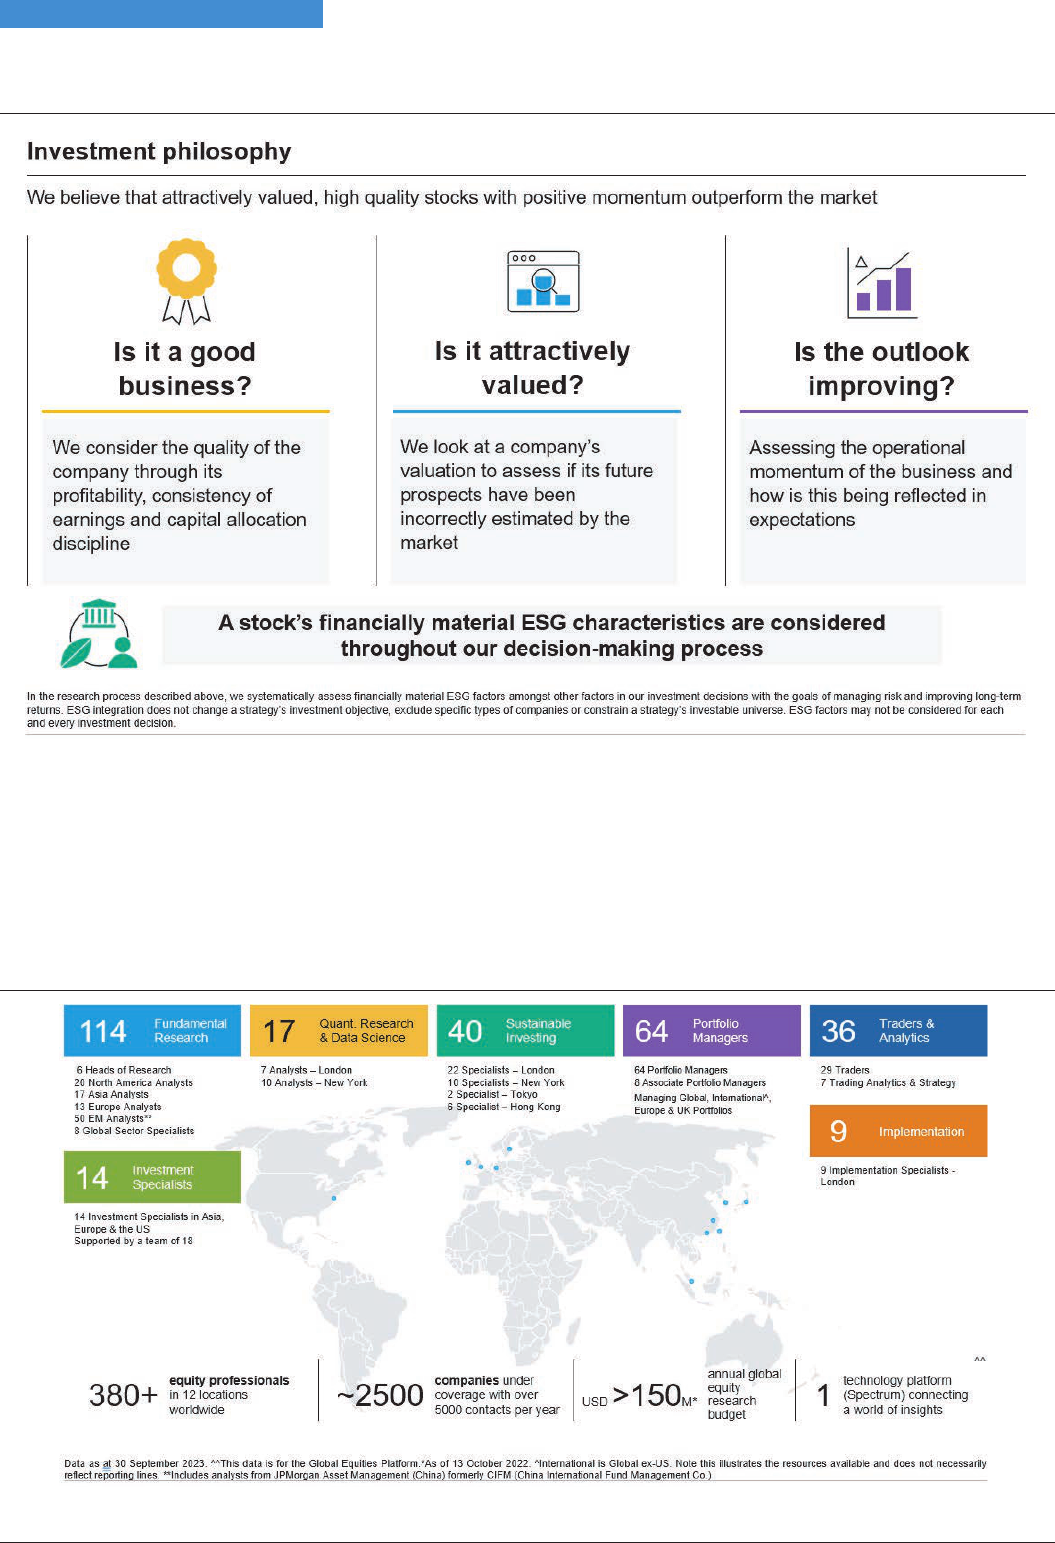
The primary source of investment ideas is the Investment Manager’s proprietary quantitative investment screening process
(‘Data Driven Insights’ above) that ranks stocks within the Company’s investment universe according to their valuation, quality,
and momentum characteristics. Valuation is assessed using metrics such as valuation multiples, a total expected return
framework and discounted cash flow analysis. Quality is judged on characteristics such as return on capital, whether earnings
can be maintained, and capital discipline, while Momentum is considered in terms of potentially positive catalysts such as
whether acompany is exceeding the market’s earnings estimates.
European Discovery AR 02 Strategic Report p04-43.qxp 20/06/2024 09:47 Page 19
Fundamental Research
After identifying companies with characteristics that meet the Portfolio Managers’ quantitative requirements, the investment
process progresses to in-house fundamental research. At this stage, the Portfolio Managers draw on JPMorgan’s extensive
analytical and technological resources. The continental European small cap team is part of the wider International Equity Group
at JPMorgan, so the Portfolio Managers have access to the expertise of close to 100 investment professionals in this group, as
well as JPMorgan’s broader global resources. Crucially, the Portfolio Managers also evaluate each investment opportunity using
their own skills, knowledge, and experience.
International Equity Group: Drawing on resources around the world
Manager’s Investment Process
20 JPMorgan European Discovery Trust plc – Annual Report & Financial Statements 2024
Strategic Report
European Discovery AR 02 Strategic Report p04-43.qxp 20/06/2024 09:47 Page 20

Manager’s Investment Process
J.P. Morgan Asset Management 21
Strategic Report
Portfolio Construction
This in-depth, bottom-up fundamental research allows the Portfolio Managers to construct a concentrated, best ideas portfolio
of Europe’s hidden gems. The Company’s investment guidelines do not prohibit the Portfolio Managers from investing in any
sector or country. Rather, they pursue the best opportunities given the prevailing market environment.
Any investment portfolio is subject to a range of potential risks, which may be stock or style specific, or related to the economic
environment, or to conditions within a given sector or country. The Portfolio Managers utilise JPMorgan’s proprietary risk tools to
ensure that the portfolio’s risk exposures are identified and evaluated.
Sell Discipline
The Portfolio Managers employ a strict sell discipline. A portfolio holding will be sold if:
• The market capitalisation has significantly outgrown the benchmark index;
• There is a deterioration in the underlying fundamental investment thesis;
• The valuation has become unattractive; or
• Better investment opportunities are identified.
Decision analytics framework
Over the past year the Portfolio Managers launched a project to analyse the performance impact of both successful and
unsuccessful investment decisions. Initially, they looked at both internal analysis and third-party software products designed for
this purpose, but they quickly realised there were significant limitations to existing offerings. Principally, both internal and
external providers are only able to analyse trades undertaken and are unable to consider the opportunity costs of actions not
taken (due to the lack of associated data).
Historical analysis can help determine whether, on average, portfolio managers should hold investments for more or less time
than they do; whether larger positions should be taken to maximise returns, or if more equal weighting between investments
would be appropriate. However, the difficulty with this approach is that most decisions made on a daily basis do not result in
investments. Yet, decisions not to invest are just as potentially significant for returns as decisions to invest. For example, if an
investor considered three AI-related technology stocks at the start of the financial year, and chose to purchase only one, that
decision was likely a good one, but the decision not to invest in the other two was probably detrimental to performance. To
complete this form of analysis, it is necessary to consider all three decisions.
To this end, the Portfolio Managers have started to develop a more complete framework through which to analyse each part of
their decision-making behaviour. This framework records all their decisions in more detail, to build a better picture of their
biases, strengths and weaknesses. Specifically, the framework records decisions related to the Portfolio Managers’ interactions
with company management teams and in-house and external analysts pitching ideas. It also captures their responses to
JPMorgan’s proprietary quantitative analysis and to daily company news flow and share price movements. Their decisions on
single stocks as well as the whole portfolio are also factored into the analysis.
The intention of this new, more comprehensive approach is to derive unique insights to improve investment decision-making,
and help the Portfolio Managers answer the key question driving this work: what is the most effective use of their time? Time is
afinite and valuable resource, and they want to ensure theirs is allocated most effectively, in those investment areas most likely
to benefit the Company’s investors.
Portfolio Gearing and Liquidity
The Board has set a liquidity range of between 20% cash and 20% gearing within which the Portfolio Managers may operate. This
gives the investment team further flexibility to adjust portfolio risk according to their assessment of the market outlook, by
leveraging up individual positions in which they have a high conviction, to amplify expected returns.
In addition, gearing and the closed-end nature of the fund allow the Portfolio Managers to take advantage of opportunities as
soon as they arise, by using gearing as a form of liquidity until market conditions provide them with the opportunity to raise cash
from other portfolio positions.
Less Liquid positions
The Company’s closed-ended nature means that it does not have to deal with daily cash flows into and out of the fund. This has
the advantage of allowing the Portfolio Managers to invest in smaller, publicly traded, but less liquid, positions. Such ‘illiquid’ or
less liquid companies, provide the Investment Managers with attractive opportunities to invest in ‘undiscovered gems’ which are
typically overlooked by open-ended funds due to the liquidity limits under which such funds operate.
European Discovery AR 02 Strategic Report p04-43.qxp 20/06/2024 09:47 Page 21

Currency Hedging
The Company does not hedge the currency exposure of its portfolio assets. This policy is based on the view that the performance
impact of foreign exchange rate fluctuations evens out over the longer term.
Environment, Social and Governance (ESG) considerations
The Portfolio Managers consider financially material ESG factors as part of the investment process, specifically where they see
related risks as a potential threat to the long-term earnings capacity of portfolio companies. Further details of the Investment
Manager’s approach to ESG integration and stewardship is set out in the ESG Report on pages 30 to 32.
Stock Examples
The following are two examples of current investments resulting from the investment process outlined above.
Elis
Stock Overview
Elis provides services for the rental and cleaning of work textiles such as hotel and restaurant linen, workwear, and personal
protection equipment. It serves healthcare, hospitality, industrial, and trade sectors worldwide. Following the acquisition of
Berendsen in 2017, Elis has grown to be the European leader in textile services, with top positions in most key sectors. It is also
present in Latin America, where it benefits from a first-mover advantage.
Investment Thesis
We think Elis is attractively valued given the earnings growth potential, the defensive nature of the business and the
consistency of its capital allocation.
Outsourcing the cleaning of work materials (such as hotel bed linen) offers significant efficiency potential for Elis’s clients who
see it as a secondary function to their main business. Because of this, Elis’s market should continue to grow above GDP rates
as clients grab the opportunity this represents. Due to its scale in the European market, Elis is the most dependable
outsourcing partner and has the highest quality of service, two attributes which we believe will result in continued market
share gains. Alongside this, as the market is still fragmented, Elis should also be able to acquire smaller competitors at
attractive prices. Weexpect Elis to grow its top-line at a mid-to-high-single digit rate over time.
As Elis continues to grow, operational margins should also improve. The more clients Elis serves in a specific area, the higher
the profitability of the area because of the high fixed costs involved (laundry equipment, staff, trucks). The regions with the
highest sales density such as France have materially higher than average margins, which gives us confidence in Elis’s ability to
improve margins in less mature regions. This should result in very robust earnings growth.
The management is also committed to reducing the amount of debt on the balance sheet. Not only will this result in lower
financial costs, but our experience is that reduced financial leverage result in higher valuation multiples and is therefore value
accretive. As Elis continues to de-leverage, we think the stock could re-rate over time.
De’Longhi
Stock Overview
De’Longhi is an Italian manufacturer of coffee machines and small kitchen appliances. It is the global leader in espresso
machines and is twice the size of its next competitor in this business. The company also owns well-known cooking equipment
brands such as Kenwood, Braun and Nutribullet.
Investment Thesis
Thanks to its ‘affordable quality’ brand perception, De’Longhi should continue to benefit from the high-single-digit annual
growth in global coffee consumption, which is mostly driven by emerging markets. Coffee consumption per capita in Asia is
still 9x less than in Europe. The high growth in Asia is likely to continue over the medium-term.
This does not mean there is no growth in developed markets. Today, only around 10% of coffee machines sold are espresso
machines. As consumers continue to shift from filter coffee to espresso, the demand for De’Longhi machines will continue to
rise.
Over time, consumers upgrade from capsules machines to fully automatic coffee beans machines. This considerably
increases the average selling price for De’Longhi, as well as the margin that the company can generate on each machine. This
premiumisation trend should continue to improve the company’s profitability.
Lastly, the company’s strong balance sheet and high free cash flow conversion will allow the company to selectively invest in
M&A. The company considerably strengthened its cooking appliances business with the acquisition of United Brands in 2020. By
acquiring La Marzocco in late 2023, the company also entered the fast-growing and highly profitable professional coffee market.
Manager’s Investment Process
22 JPMorgan European Discovery Trust plc – Annual Report & Financial Statements 2024
Strategic Report
European Discovery AR 02 Strategic Report p04-43.qxp 20/06/2024 09:47 Page 22

Portfolio information
J.P. Morgan Asset Management 23
Strategic Report
Ten largest equity investments
At 31st March
2024 2023
3
Valuation Valuation
Number Number
Company Country of shares £’000 %
1
of shares £’000 %
1
1
Based on total investments of £829.7m (2023: £839.6m).
2
Not included in the ten largest investments at 31st March 2023.
3
At 31st March 2023, the value of the ten largest investments amounted to £282.2m representing 33.6% of total investments.
SPIE
SPIE is the independent European leader in multi-technical
services in the areas of energy and communication.
France
22,143 2.7
CTS Eventim
2
CTS Eventim produces, sells, brokers and distributes entry
tickets for concerts, theater productions, artistic, sporting and
similar events.
Fugro
2
Fugro collects, processes and interprets geological data. The
company collects data at sea, on land, and from the air of land
areas and the sea bed. The data is used in building offshore oil
platforms, tunnels, roads, pipelines, factories and communication
cables and to explore for oil, gas and minerals.
De’Longhi
2
De’Longhi is a designer, manufacturer and distributor of small
domestic appliances worldwide, with market shares in the espresso
coffee makers, food preparation, comfort and home care
segments.
SCOR
2
SCOR operates as a reinsurance company that offers property
and casualty, life and health, and reinsurance solutions.
Merlin Properties Socimi, REIT
2
Merlin Properties Socimi, is a real estate investment trust that
acquires, actively manages, operates and invests in commercial
real estate.
Spain 1,998,019
17,005 2.0
Total 193,387 23.4
743,826
KION
2
KION provides material handling solutions. The Company offers
forklifts, warehouse equipments and other industrial trucks.
Bilfinger
2
Bilfinger SE provides industrial services, power services, building
and facility services, construction and concessions.
Elis
Elis pr
ovides commercial services. The company offers rental and
cleaning of textile and hygiene articles such as workwear, linen,
air purification products, dryers, personal protection equipment,
automatic dispensers, mats, mops, beverage machines,
consumables, and accessories.
BFF Bank
2
BFF Bank is a specialty finance company operating throughout
Europe, specialised in the management and non-recourse
factoring of trade receivables due from public administrations,
securities services, banking and corporate payments.
1,595,548 37,489 4.5
— — —
Italy 1,712,579
18,112 2.2 868,775 6,985 0.8
France 662,648
18,163 2.2 — — —
Italy 696,397
19,088 2.3 — — —
Netherlands
987,940
19,156 2.3 — — —
France 1,085,967
19,553 2.4 1,539,404 23,847 2.8
Germany 279,501
19,750 2.4 440,312 22,266 2.7
Germany 534,878
19,810 2.4 305,957 10,517 1.3
Germany 493,821
20,607 2.5 — — —
European Discovery AR 02 Strategic Report p04-43.qxp 20/06/2024 09:47 Page 23

Geographical analysis
31st March 2024 31st March 2023
Portfolio Benchmark Portfolio Benchmark
%
1
% %
1
%
Germany 21.7 13.3 12.4 13.7
France 20.2 11.0 20.0 10.8
Italy 14.8 10.1 19.2 9.7
Sweden 12.1 17.3 15.7 16.6
Netherlands 5.8 5.0 9.9 6.0
Denmark 5.7 6.3 1.9 5.9
Spain 4.1 5.7 1.2 5.3
Austria 3.9 2.8 1.1 2.7
Norway 3.9 6.9 0.9 6.4
Switzerland 2.7 12.9 8.6 13.5
Finland 1.9 3.4 1.7 3.8
Belgium 1.7 3.5 7.4 4.1
Ireland 1.5 0.9 — 0.7
Portugal — 0.9 — 0.8
Total 100.0 100.0 100.0 100.0
1
Based on total investments of £829.7m (2023: £839.6m).
Sector analysis
31st March 2024 31st March 2023
Portfolio Benchmark Portfolio Benchmark
%
1
% %
1
%
Industrials 32.7 29.0 48.5 30.1
Consumer Discretionary 19.7 11.8 17.2 11.8
Financials 13.3 14.6 11.7 14.0
Information Technology 8.1 9.2 15.2 9.9
Healthcare 6.0 8.5 0.1 7.4
Energy 5.2 4.0 — 3.3
Real Estate 4.8 7.8 1.7 7.1
Consumer Staples 4.1 5.3 1.9 5.4
Materials 3.1 5.5 3.4 6.1
Utilities 1.5 2.6 — 2.8
Communication Services 1.5 1.7 0.3 2.1
Total 100.0 100.0 100.0 100.0
1
Based on total investments of £829.7m (2023: £839.6m).
Portfolio information
24 JPMorgan European Discovery Trust plc – Annual Report & Financial Statements 2024
Strategic Report
European Discovery AR 02 Strategic Report p04-43.qxp 20/06/2024 09:47 Page 24

Portfolio Information
J.P. Morgan Asset Management 25
Strategic Report
Investment activity
During the year ended 31st March 2024
Value at Value at
31st March 2023 Change 31st March 2024
% of
Purchases Sales in value % of
£’000 Portfolio £’000 £’000 £’000 £’000 Portfolio
Germany 104,313 12.4 146,734 (87,846) 15,833 179,034 21.7
France 167,901 20.0 100,372 (102,529) 1,491 167,235 20.2
Italy 161,074 19.2 97,018 (146,936) 11,997 123,153 14.8
Sweden 131,885 15.7 106,759 (123,940) (15,191) 99,513 12.1
Netherlands 83,328 9.9 28,660 (69,371) 5,512 48,129 5.8
Denmark 15,842 1.9 53,899 (27,869) 4,953 46,825 5.7
Spain 9,806 1.2 27,311 (9,565) 7,105 34,657 4.1
Austria 9,451 1.1 23,923 (3,364) 2,999 33,009 3.9
Norway 7,855 0.9 24,529 (298) 889 32,975 3.9
Switzerland 71,730 8.6 33,998 (84,889) 1,201 22,040 2.7
Finland 14,021 1.7 10,400 (4,074) (3,717) 16,630 1.9
Belgium 62,376 7.4 12,906 (52,061) (9,071) 14,150 1.7
Ireland — — 11,690 (1,109) 1,807 12,388 1.5
Total investments 839,582 100.0 678,199 (713,851) 25,808 829,738 100.0
European Discovery AR 02 Strategic Report p04-43.qxp 20/06/2024 09:47 Page 25

Germany
KION 20,607 2.5
Bilfinger 19,810 2.4
CTS Eventim 19,750 2.4
Scout24 16,532 2.0
FUCHS Preference 16,417 2.0
Hensoldt 13,912 1.7
Freenet 12,427 1.5
TAG Immobilien 11,561 1.4
Stabilus 10,868 1.3
Evotec 9,195 1.1
Bechtle 8,137 1.0
Fielmann 7,705 0.9
AIXTRON 5,586 0.7
Atoss Software 4,569 0.6
SAF-Holland 1,958 0.2
179,034 21.7
France
SPIE 22,143 2.7
Elis 19,553 2.4
SCOR 18,163 2.2
IPSOS 15,668 1.9
SEB 15,024 1.8
Sopra Steria 14,380 1.7
Gaztransport Et Technigaz 12,384 1.5
Covivio 11,760 1.4
Alten 11,386 1.4
Nexans 9,215 1.1
Vallourec 8,887 1.1
Virbac 8,672 1.0
167,235 20.2
Italy
De’Longhi 19,088 2.3
BFF Bank 18,112 2.2
Sanlorenzo 16,637 2.0
Saipem 14,008 1.7
BPER Banca 12,021 1.4
Unipol Gruppo 10,158 1.2
Brembo 9,124 1.1
Lottomatica 7,716 0.9
A2A 6,746 0.8
Iren 5,811 0.7
Intercos 3,732 0.5
123,153 14.8
Sweden
AAK 14,612 1.8
Bravida 13,698 1.7
Munters 11,780 1.4
Loomis 10,545 1.3
Electrolux Professional 10,447 1.3
Hexpol 9,533 1.1
BoneSupport 9,151 1.1
Thule 8,429 1.0
Sweco 6,521 0.8
Husqvarna 4,797 0.6
99,513 12.1
Netherlands
Fugro 19,156 2.3
Koninklijke Vopak 15,107 1.8
Arcadis 13,866 1.7
48,129 5.8
Denmark
ISS 10,453 1.3
Sydbank 10,382 1.3
Zealand Pharma 9,298 1.1
NKT 9,268 1.1
Jyske Bank 7,424 0.9
46,825 5.7
Spain
Merlin Properties Socimi 17,005 2.0
Banco de Sabadell 13,566 1.6
Fluidra 4,086 0.5
34,657 4.1
Austria
DO & CO 16,528 2.0
BAWAG 8,488 1.0
Wienerberger 4,276 0.5
ANDRITZ 3,717 0.4
33,009 3.9
Norway
Bakkafrost 13,450 1.6
Storebrand 11,808 1.4
Aker Solutions 7,717 0.9
32,975 3.9
Switzerland
Accelleron Industries 13,708 1.7
Inficon 8,332 1.0
22,040 2.7
Valuation % of
Company £’000 Portfolio
Valuation % of
Company £’000 Portfolio
List of investments
At 31st March 2024
Portfolio Information
26 JPMorgan European Discovery Trust plc – Annual Report & Financial Statements 2024
Strategic Report
European Discovery AR 02 Strategic Report p04-43.qxp 20/06/2024 09:47 Page 26

Portfolio Information
J.P. Morgan Asset Management 27
Strategic Report
Finland
Tokmanni 8,543 1.0
TietoEVRY 6,057 0.7
Puuilo 2,030 0.2
16,630 1.9
Belgium
Fagron 13,742 1.7
Melexis 408 —
14,150 1.7
Ireland
Cairn Homes 6,542 0.8
Glanbia 5,846 0.7
12,388 1.5
Total Investments 829,738 100.0
Valuation % of
Company £’000 Portfolio
European Discovery AR 02 Strategic Report p04-43.qxp 20/06/2024 09:47 Page 27
1
Source: Morningstar, share price. JPMorgan, share price total return calculation.
2
Source: Morningstar, cum income net asset value per share. JPMorgan, net asset value total return calculation.
3
Source: Morningstar. The Company’s benchmark.
1
Source: Morningstar, share price. JPMorgan, share price total return calculation.
2
Source: Morningstar, cum income net asset value per share. JPMorgan, net asset value total return calculation.
3
Source: Morningstar. The Company’s benchmark.
Ten year performance
Figures were rebased to 100 on 31st March 2014
50
100
150
200
250
300
20242023202220212020201920182017201620152014
Share price total return
1
Net asset value total return
2
Benchmark total return
3
Ten year performance relative to benchmark
Figures were rebased to 100 on 31st March 2014
85
90
95
100
105
110
115
120
125
20242023202220212020201920182017201620152014
Share price total return
1
Net asset value total return
2
Benchmark total return
3
Ten Year Record
28 JPMorgan European Discovery Trust plc – Annual Report & Financial Statements 2024
Strategic Report
European Discovery AR 02 Strategic Report p04-43.qxp 20/06/2024 09:47 Page 28

Ten Year Record
J.P. Morgan Asset Management 29
Strategic Report
Ten year financial record
At 31st March 2014 2015 2016 2017 2018 2019 2020 2021 2022 2023 2024
Total assets less current
liabilities (£’m) 474.8 473.1 495.4 620.8 794.2 637.8 517.3 923.0 833.7 785.1 841.7
Net asset value per share (p)
A
270.7 268.3 309.3 388.1 438.9 400.0 324.4 530.7 526.1 498.5 520.7
Share price (p) 240.0 233.5 276.0 334.0 406.0 349.0 251.0 462.0 450.0 423.0 465.5
Share price discount (%)
A
11.3 13.0 10.8 13.9 7.5 12.8 22.6 12.9 14.5 15.1 10.6
Gearing (%)/(Net cash)
A
12.6 7.5 (2.8) 5.3 7.9 (5.2) 3.8 8.8 0.0 6.9 7.9
Ongoing charges (%)
A
1.31 1.32 1.18 1.15 1.03 1.07 1.05 0.91 0.93 0.94 0.92
Year ended 31st March
Gross revenue return (£’000) 8,016 8,586 8,448 10,771 13,251 15,837 15,077 9,625 16,498 22,502 23,982
Net revenue available for
shareholders (£’000) 5,047 5,519 5,732 7,807 9,575 11,680 10,886 7,051 11,154 17,512 18,670
Revenue return per share (p) 2.99 3.45 3.58 4.88 5.98 7.31 6.83 4.42 7.00 11.11 12.04
Total dividend(s) per share (p) 2.9 3.2 3.2 4.7 6.7 6.7 6.7 6.7 6.7 9.0 10.5
Rebased to 100 at 31st March 2013
Total return to shareholders
1,A
100.0 98.6 118.0 144.5 177.8 155.3 113.8 213.4 210.7 201.7 227.8
Total return on net assets
2,A
100.0 100.3 116.9 148.2 169.4 156.7 129.1 214.6 215.2 207.0 221.0
Benchmark total return
3
100.0 100.1 107.3 138.4 152.2 146.7 128.0 202.1 209.9 203.1 215.2
1
Source: Morningstar, share price. JPMorgan, share price total return calculation.
2
Source: Morningstar, cum income net asset value per share. JPMorgan, net asset value total return calculation.
3
Source: Euromoney. The Company’s benchmark is the MSCI Europe (ex UK) Small Cap Net Total Return Index. (2019 and before: Euromoney Smaller
European Companies (ex UK) Total Return Index in sterling terms).
A
Alternative Performance Measure (‘APM’).
A glossary of terms and APMs definitions is provided on pages 101 and 102.
European Discovery AR 02 Strategic Report p04-43.qxp 20/06/2024 09:47 Page 29
Manager’s Approach to ESG and JPMorgan European Discovery Trust plc
Why do we integrate ESG into our investment process?
In actively managed strategies deemed by J.P. Morgan Asset Management (UK) Limited (‘JPMAM’) to be ESG integrated under our
governance process, we systematically assess financially material ESG factors (amongst other factors) in our investment
analysis and investment decisions, where possible and appropriate, with the goals of managing risk and improving long-term
returns. Essentially, we seek to determine whether, in our opinion, a company faces potential headwinds or tailwinds from ESG
considerations which may ultimately have a significant impact on its share price.
ESG Integration within the Company’s portfolio
ESG integration does not change the Company’s investment objective, exclude specific types of companies, or constrain the
Company’s investable universe. However, our assessment of financially material ESG factors may influence the investment
decision. Ultimately, it may impact our Investment Manager’s decision to purchase a company or not, or impact the position size
taken in a Company due to the level of conviction.
Engagement
We recognise and embrace our wider stewardship responsibilities to clients as a major asset owner. We use engagement to
better understand and encourage portfolio companies to develop and adopt practices to manage their risk and create
long-term shareholder value. Active ownership in the context of ESG integration allows us to manage ESG risks and
systematically to incorporate insights gained from engagement into our investment decisions. For further details on our
engagement processes, please see JPMAM’s Annual Investment Stewardship Report Annual Investment Stewardship Report
(https://am.jpmorgan.com/content/dam/jpm-am-aem/global/en/sustainable-investing/investment-stewardship-report.pdf
).
In JPMAM’s International Equity Group, corporate engagement is a collaboration between our investors and the Investment
Stewardship specialists within our Global Sustainable Investing Team. Engagement driven by our Investment Stewardship team
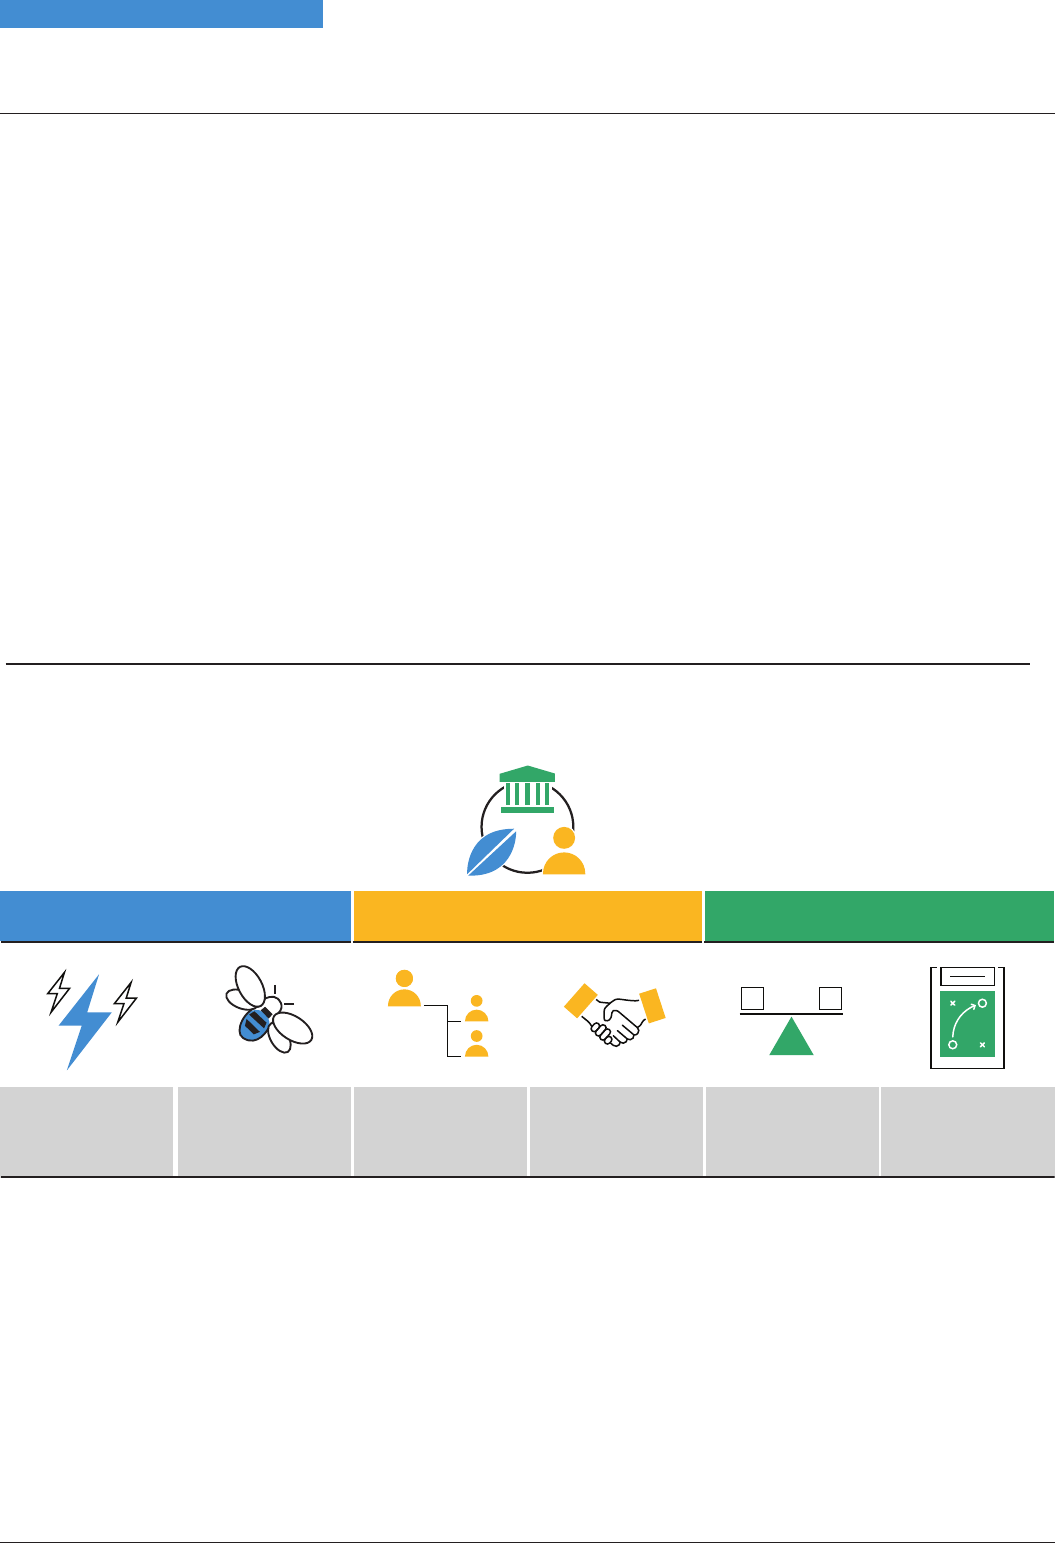
focuses on the six firm-wide priorities below.
Underlying each priority are specific themes, which are typically topical issues within the industry and with our clients. JPMAM’s
Investment Stewardship Team has identified a set of ‘focus’ companies, aligned with these themes, which we proactively target
for engagement. These companies are selected because of an issue of concern, typically in reference to our six priorities, that is
sufficiently material to warrant more focused engagement and where the name is held in sufficient size to make our voice
effective. The list of companies will be validated as part of ongoing dialogue between the Investment Stewardship Team and the
Portfolio Managers and Research Analysts.
Portfolio Managers and Research Analysts in the International Equity Group (IEG) also directly drive engagement with the
companies, addressing a broad range of financially material ESG issues as part of their bottom-up stock analysis.
Examples of our recent activity with regard to engagement with stocks in the Company’s portfolio during the year are provided
below:
Environmental Social Governance
Climate change
Natural capital
and ecosystems
Governance
Strategy
alignment with
the long term
Human capital
management
Stakeholder
engagement
Environmental, Social and Governance (‘ESG’) Report
30 JPMorgan European Discovery Trust plc – Annual Report & Financial Statements 2024
Strategic Report
European Discovery AR 02 Strategic Report p04-43.qxp 20/06/2024 09:47 Page 30

Environmental, Social and Governance (‘ESG’) Report
J.P. Morgan Asset Management 31
Strategic Report
Our IEG investors met with SPIE to discuss the company’s ESG initiatives. Our objectives were to: (i) clarify what operations fall
under the company’s oil, gas & nuclear business division and if they have any direct nuclear exposure; (ii) clarify the drivers of
the company’s scope 1, 2 and 3 emission reduction targets; and (iii) discuss the drivers of the recent third-party downgrade of
SPIE’s ESG rating.
SPIE confirmed that they did not have any direct nuclear exposure. Their oil, gas & nuclear business division accounted for 7%
revenues in 2022. This work is predominantly for taking care of clients’ fire safety and electrical networks. Next, the company is
confident that they will be able to meet their 2025 targets for scope 1 and scope 2 emissions. These emissions are mainly from
SPIE’s large vehicle fleet which they are currently renewing progressively into electric vehicles. Finally, MSCI downgraded their
ESG rating for SPIE from A to BBB, citing their assessment of SPIE’s labour management practices and limited evidence of their
robust staff development programmes. SPIE has refuted this assessment and has been engaging with MSCI, but said they have
had limited success so far.
Our portfolio management team met with Arcadis, the engineering and consulting company, at their recent capital markets day.
We raised the issue of per- and polyfluorinated substances (PFAS), which are used to make fluoropolymer coatings and products
that resist heat, oil, stains, grease and water. These are also known as ‘forever chemicals’ as they are unable to breakdown
naturally. We wanted to understand the implications of their usage across the world and what steps the company is taking
inorder to tackle the issues. The company noted that the market for PFAS is forecasted to be >$160 billion over the next
20-30years. This means that the growing consumption of PFAS chemicals has serious implications. Arcadis are aware of their
leadership position in the market, and are at the forefront of R&D developing remediation solutions to help tackle the problem.
They assured us that they were working with organisations such as the US Army and universities globally to both develop clean
up solutions and to help transition to a PFAS-free world through alternatives such as PFAS-free firefighting foams. We look
forward to seeing more progress on possible solutions from Arcadis and see how the business develops in the future.
Proxy voting
J.P. Morgan Asset Management exercises the voting rights of shares held in client portfolios, where entrusted with this
responsibility. We seek to vote in a prudent and diligent manner, based exclusively on our reasonable judgement of what will best
serve the financial interests of our clients. We aim to vote at all meetings called by the companies in which we are invested,
unless there are any market restrictions or conflicts of interests.
We believe that corporate governance is integral to our investment process. We examine the share structure and voting
structure of the companies in which we invest, as well as the balance of the Board, effectiveness of oversight functions and the
remuneration policy. For full details, please see the J.P. Morgan Asset Management Corporate Governance Policy & Voting
Guidelines, copies of which are available on request, or to download from our website.
A summary of key voting statistics and activity for the Company during the year is detailed below:
Against/ Against/
Did Not Abstain Abstain
For Against Abstain Vote* Total (number) (%)
Audit Related 58 7 0 2 67 7 10%
Capitalisation 91 14 0 3 108 14 13%
Company Articles 28 3 0 3 34 3 9%
Compensation 181 51 0 8 240 51 21%
Director Election 222 36 0 13 271 36 13%
Director Related 185 13 0 9 207 13 6%
Miscellaneous 3 0 0 0 3 0 0%
Non-Routine Business 10 0 0 1 11 0 0%
Routine Business 189 10 0 8 207 10 5%
Social 0 1 0 0 1 1 100%
Strategic Transactions 1 1 0 1 3 1 33%
Takeover Related 0 3 0 0 3 3 100%
Total 968 139 0 48 1,155 139
*Meetings may not be voted due to share blocking and/or conflicts of interest.
European Discovery AR 02 Strategic Report p04-43.qxp 20/06/2024 09:47 Page 31

Two examples of our proxy voting activity over the last year are provided below.
Brembo SpA
Issue
Brembo SpA is an Italian automotive parts manufacturer. At the 2023 Annual General Meeting, shareholders were asked to
submit an advisory vote on the company’s Remuneration Report for the financial year 2022 (FY22) in addition to a binding vote
on the forward-looking Remuneration Policy. We have had concerns with several aspects of the company’s remuneration
proposals over successive years. In FY22, a one-off award of EUR 800,000 was paid to the Chief Executive Officer which was not
linked to pre-determined performance conditions. In its Remuneration Policy, the company also continues not to disclose the
weightings and targets of its cash-based Long-Term Incentive Plan (LTIP) preventing shareholders from assessing the
robustness of the Plan’s metrics. Neither of these features are considered in-line with market standards.
Action
When reviewing remuneration proposals, we take into consideration a company’s progress and responsiveness to shareholder
feedback over time, in addition to the merits and features of the individual proposals. In the case of Brembo SpA, whilst we
acknowledged that certain aspects of remuneration-related disclosure has improved over the past few years, we remained
concerned around the board’s discretionary use of one-off awards and the inadequate disclosure of LTIP targets in the
forward-looking Remuneration Policy.
Outcome
As we were unable to allay our concerns, we voted against the Remuneration Report and the Remuneration Policy resolutions
at the company’s Annual General Meeting. The resolutions received significant dissent at the general meeting. We will continue
to monitor the company’s remuneration practices going forward.
Bechtle AG
Issue
Bechtle AG is a German listed IT services provider. At the 2023 Annual General Meeting, shareholders voted on the election of
two new board members and the re-election of several incumbent directors. Independence of the Board and its key
committees is crucial in ensuring effective oversight of company strategy and material risks. Our view is that an audit
committee should consist solely of non-executive directors who are independent of management; however Bechtle AG fell
short of this requirement. Furthermore, the proposed term for all directors up for election was five years which raised concerns.
Action
In our analysis of the Board and the composition of key committees, we carefully considered market context and best practice.
Ultimately, we determined that one of the Audit Committee members could not be considered fully independent given the
length of his tenure on the Board had already exceeded 20 years. Although five years is common practice in Germany, we
believe that shorter terms serve to enhance shareholder rights by allowing more regular evaluation of the performance of the
director and therefore Board accountability. Shorter terms also strengthen board refreshment.
Outcome
We voted against the director who was a member of the Audit Committee and who we considered not independent based on
his tenure. In addition, we voted against the election of all directors on the basis of the proposed five-year terms. We will
monitor the company practices going forward and seek to encourage and promote convergence with international best
practice for governance.
Task Force on Climate-related Financial Disclosures (TCFD)
JPMorgan Asset Management (UK) Limited (‘JPMAMUK’) is an asset manager, operating in the UK as part of J.P. Morgan Asset
Management (‘JPMAM’). JPMAM is the marketing name for the investment management businesses of JPMorgan Chase & Co.
worldwide. As a global asset management group, JPMAM seeks to adopt a consistent approach in its strategy and management
of client assets, including with respect to climate risks and opportunities. Accordingly, this UK addendum, is supplemental to
and should be read together with JPMAM’s Global Task Force for Climate Related Financial Disclosures Report (2023 TCFD
Report). More details on page 106.
J.P. Morgan Asset Management
Environmental, Social and Governance (‘ESG’) Report
32 JPMorgan European Discovery Trust plc – Annual Report & Financial Statements 2024
Strategic Report
European Discovery AR 02 Strategic Report p04-43.qxp 20/06/2024 09:47 Page 32

Business Review
J.P. Morgan Asset Management 33
Strategic Report
The Company’s Purpose, Values, Strategy and
Culture
The purpose of the Company is to provide a cost effective,
investment vehicle for investors who seek capital growth from
a portfolio of high-quality smaller companies in Continental
Europe, over the long term. To achieve this, the Board of
Directors is responsible for employing and overseeing an
investment management company that has appropriate
investment expertise, resources and controls in place to meet
the Company’s investment objective. To ensure that it is
aligned with the Company’s purpose, values and strategy, the
Board comprises non-executive Directors from a diverse
background, including gender and ethnicity, who have a
breadth of relevant experience and contribute in an open and
transparent boardroom culture that both supports and
challenges the Manager and its other third party suppliers.
All Directors act with integrity, lead by example and seek to
promote the Company’s culture through ongoing dialogue
and engagement with its stakeholders.
Investment Objective
JPMorgan European Discovery Trust plc is an investment trust
company that has a premium listing on the London Stock
Exchange. It is a constituent of the FTSE 250 Index. The
Company is incorporated in England and Wales. Its objective
is to achieve capital growth from smaller Continental
European companies. In seeking to achieve this objective, the
Company employs JPMorgan Funds Limited (‘JPMF’) which, in
turn, delegates portfolio management to JPMorgan Asset
Management (UK) Limited (‘JPMAM’) to actively manage the
Company’s assets. The Board has determined an investment
policy and related guidelines and limits as described below. It
aims to outperform the MSCI Europe (ex UK) Small Cap Net
Total Return Index.
The Company is subject to legislation and regulations
including UK company law, United Kingdom Accounting
Standards, the FCA Listing, Prospectus, Disclosure Guidance
and Transparency Rules, Market Abuse Regulation, taxation
law and the Company’s own Articles of Association.
The Company is an investment company within the meaning
of Section 833 of the Companies Act 2006 and has been
approved by HM Revenue & Customs as an investment trust
(for the purposes of Sections 1158 and 1159 of the Corporation
Tax Act 2010). As a result the Company is not liable for taxation
on capital gains. The Directors have no reason to believe that
approval will not continue to be retained. The Company is not
a close company for taxation purposes.
Investment Policies and Risk Management
In order to achieve its investment objective and to seek to
manage investment risks, the Company invests in a
diversified portfolio of high-quality smaller companies in
Continental Europe. The investment universe is defined at the
time of purchase by the countries and market capitalisation
range of the constituents of the benchmark index which, at
the end of March 2024, consisted of 674 companies with afree
float adjusted market capitalisation range of GBP 200 million
to GBP 7 billion.
The Company manages liquidity and borrowings with the aim
of increasing potential Sterling returns to shareholders. The
Company borrows in Euros in order to hedge the currency risk
in respect of the geared portion of the portfolio. The Company
does not normally hedge the foreign currency exposure of the
remainder of the portfolio.
The investment policy emphasises capital growth rather than
income and shareholders should therefore expect dividends
to vary from year to year.
The Board has set no minimum or maximum limits on the
number of investments in the portfolio but, in the year under
review, the number of investments ranged between
approximately 50-80. To gain the appropriate exposure, the
investment managers are permitted to invest in collective
investment schemes. On a day-to-day basis, the assets are
managed by three investment managers based in London,
supported by a team of over 99 equity professionals.
Investment Restrictions and Guidelines
The Board seeks to manage the risks facing the Company by
imposing various limits and restrictions;
• The Company will not invest more than 5% of its total
assets in any one individual stock at the time of
acquisition.
• No more than 25% of assets may be invested outside the
benchmark. Any such investments must be in European ex
UK companies or a UK investment company that invests in
Europe.
• The Company does not normally invest in unquoted
investments and to do so requires prior Board approval.
• No more than 25% of the Company’s assets may be
invested in the aggregate of: (i) securities not listed on
arecognised exchange; and (ii) holdings in which the
Company has 20% or more of the issued equities. It is
unlikely that the Company would invest in companies that
fall into either of these categories and did not do so in the
year under review.
• In accordance with the FCA Listing Rules, the Company
willnot invest more than 15% of its gross assets in other
UKlisted closed-ended investment funds and will not
invest more than 10% of its gross assets in UK listed
closed-ended investment funds that themselves may
invest more than 15% of gross assets in UK listed
closed-ended investment funds. It is very unlikely that the
Company would wish to have substantial positions in such
companies and had no such investments in the year under
review.
European Discovery AR 02 Strategic Report p04-43.qxp 20/06/2024 09:47 Page 33
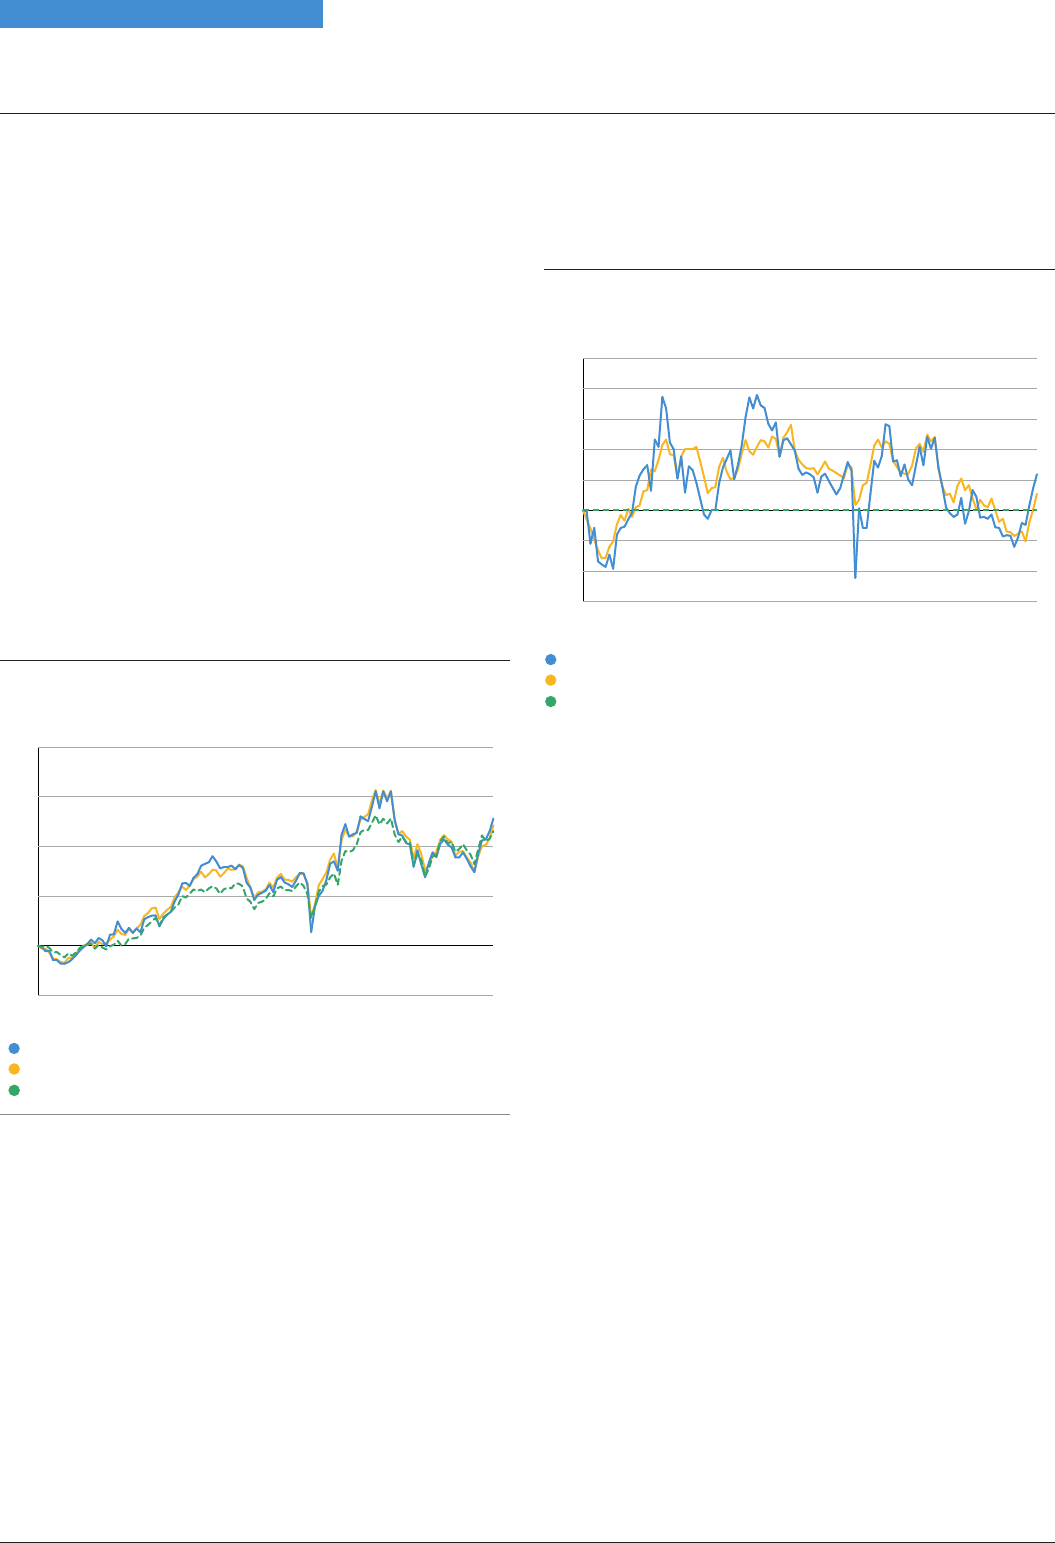
• The Board has set a normal gearing range of 20% net cash
to 20% geared.
• The Company does not normally enter into derivative
transactions and to do so requires prior Board approval.
These limits and restrictions may be varied by the Board at
any time at its discretion.
Compliance with the Board’s investment restrictions and
guidelines is monitored continuously by the Manager and is
reported to the Board on a monthly basis.
Performance
In the year ended 31st March 2024, the Company produced
ashare price total return of 13.0% and a net asset value total
return of 6.8%. This compares with the total return on the
Company’s benchmark index of 5.9%. As at 31st March 2024
the value of the Company’s investment portfolio was
£829.7million (2023: £839.6 million). The Investment
Managers’ Report on pages 11 to 18 includes a review of
developments during the year as well as information on
investment activity within the Company’s portfolio.
Ten Year Performance
Figures have been rebased to 100 since 31st March 2014
Source: Morningstar.
Key Performance Indicators (‘KPIs’)
At each Board meeting the Directors consider a number of
performance measures to assess the Company’s success in
achieving its objectives. The principal KPIs are performance
relative to the benchmark index, performance against the
Company’s peers, performance attribution, share price
discount to net asset value per share and ongoing charges.
Unless there is a particular reason for the Board to change the
KPIs (which would require an explanation to shareholders),
consistency is maintained to provide continuity. Further
details of the principal KPIs are given below.
• Performance relative to the benchmark index
This is the most important KPI by which performance is
judged. Information on the Company’s performance is
given in the Chairman’s Statement and the Investment
Managers’ Report on pages 11 to 18.
Performance Relative to Benchmark Index
Figures have been rebased to 100 since 31st March 2014
• Performance against the Company’s peers
The principal objective is to achieve capital growth relative
to the benchmark. However, the Board also monitors the
performance relative to a broad range of competitor funds
with similar objectives.
• Performance attribution
The purpose of performance attribution analysis is to
assess how the Company achieved its performance
relative to its benchmark index, i.e. to understand the
impact on the Company’s relative performance of the
various components such as stock selection and asset
allocation. Details of the attribution analysis for the year
ended 31st March 2024 are given in the Investment
Managers’ Report on page 11.
• Share price discount to net asset value (‘NAV’) per share
The Board recognises that the possibility of a short term
widening of the discount can be a key disadvantage of
investment trusts that can discourage investors, but is of
the view that over the long term it is not a material factor in
long term shareholder return. The Board has for several
years operated a share repurchase programme which
seeks to address imbalances in the supply of and demand
for the Company’s shares within the market and thereby
seek to manage the volatility and absolute level of the
discount to NAV per share at which the Company’s shares
trade. In the year ended 31st March 2024, the discount
ranged between 9.7% and 16.9%. More information on the
Board’s share repurchase policy is given in the Chairman’s
Statement on page 7.
85
90
95
100
105
110
115
120
125
20242023202220212020201920182017201620152014
Return to shareholders
Return on net assets, with debt at fair value
The benchmark is represented by the Green horizontal line
50
100
150
200
250
300
20242023202220212020201920182017201620152014
Return to Shareholders
Return on net assets, with debt at fair value
Benchmark returnBenchmark return
Business Review
34 JPMorgan European Discovery Trust plc – Annual Report & Financial Statements 2024
Strategic Report
European Discovery AR 02 Strategic Report p04-43.qxp 20/06/2024 09:47 Page 34

Business Review
J.P. Morgan Asset Management 35
Strategic Report
Discount
Source: Morningstar (month end data).
• Ongoing charges
The ongoing charges represent the Company’s management
fee and all other operating expenses, excluding any finance
costs, expressed as a percentage of the average daily net
assets during the year. The ongoing charges for the year
ended 31st March 2024 were 0.92% (2023: 0.94%). Each year
the Board reviews an analysis which shows a comparison of
the Company’s ongoing charges and its main expenses with
those of its peers.
-24
-22
-20
-18
-16
-14
-12
-10
-8
-6
-4
-2
20242023202220212020201920182017201620152014
Discount (based on month-end data)
European Discovery AR 02 Strategic Report p04-43.qxp 20/06/2024 09:47 Page 35

The Directors confirm that they conduct a robust assessment of the principal and emerging risks facing the Company. It is with
afocus on those risks that could materially adversely impact the Company’s performance, share price, reputation or the viability
of its business. The reviews are based on a risk matrix developed by the Audit Committee with the assistance of the Manager.
During the year, the Board discussed the risks and identified those that merit particular attention. At the current time these are –
investment performance, discount control and the impact of geopolitical events. At the same time, they viewed that the threat of
a recession and the adverse impact of further pandemics as having declined over the year.
The AIC Code of Corporate Governance requires the Audit Committee to put in place procedures to identify emerging risks facing
the Company. The Committee has conducted horizon scanning and other than the exacerbation of geopolitical events in Ukraine
& the Middle East, growing usage of Artificial Intelligence and continuing Climate Change, it does not believe that there are any
new emerging risks.
The risks together with how these are mitigated and managed, as far as practicable, are set out in the table below.
RISK & DESCRIPTION MITIGATION & MANAGEMENT
Investment Performance and Strategy
Performance of the Company’s investment portfolio is
fundamental to the success of the company.
An inappropriate investment strategy, or poor implementation
of the strategy, for example relating to concentration of
investments, asset allocation, the level of gearing or the degree
of portfolio risk.
Ongoing performance measurement of the portfolio computed
independently of the inves
tment managers. This is shared
within Investment Managers teams for ongoing oversight as
well as to the Board.
The Board reviews the overall strategy and structure of the
Company and reports of comparison of the performance
against benchmark, peer group and share activity. The Board
holds a separate meeting devoted to strategy each year which
includes consideration of whether the Company’s objectives
and structures are appropriate for the long-term interests of
shareholders.
Regular reports prepared by the Manager are received by the
Board on stock selection, asset allocation, gearing, hedging
and costs of running the Company and these are reviewed at
each Board meeting.
Discount/Premium Control
Shar
e price premium volatility and deep discount to net asset
value per share leads to a sense of uncertainty reducing
shareholder confidence. Potentially triggering shareholder
intervention.
The Board continuously monitors the level of the discount.
Wher
e deemed it prudent, seeks to address the imbalances in
the supply of and demand for the Company’s shares through
share repurchases.
Geopolitical
Marke
t instability and declining investment opportunities from
escalation of geopolitical conflicts such as in Ukraine and the
emerging instability in the Middle East.
The Company monitors global developments with the Manager
and ex
ternal experts on an ongoing basis.
The Board can, with shareholder approval, amend the
investment policy and objectives of the Company to mitigate
the risks arising from geopolitical instability.
Market and Currency
Uncer
tainty about the future prices and liquidity of the
Company’s investments arising from economic, social, fiscal,
climate, inflationary and regulatory changes. This covers the
impact of holding investments in the face of negative market
movements.
The company has an inherent risk exposure to the
Euro/Sterling exchange rate. The majority of the Company’s
assets, liabilities and income are denominated in Euros, rather
than in Sterling which is the Company’s functional currency
and in which it reports performance.
The Board manages these risks by diversification of
inves
tments and monitoring compliance with investment
guidelines and policies with the Investment Manager.
The Board includes an assessment of these risk factors at
meetings and has placed investment restrictions and
guidelines to limit these risks. The Board also reviews the level
of liquidity in the portfolio.
The Company borrows in Euros in order to hedge the currency
risk in respect of the geared portion of the portfolio. The
Company does not hedge the foreign currency exposure of the
remainder of the portfolio.
Principal and Emerging Risks
36 JPMorgan European Discovery Trust plc – Annual Report & Financial Statements 2024
Strategic Report
European Discovery AR 02 Strategic Report p04-43.qxp 20/06/2024 09:47 Page 36

Principal and Emerging Risks
J.P. Morgan Asset Management 37
Strategic Report
RISK & DESCRIPTION MITIGATION & MANAGEMENT
The Manager ensures appropriate performance reviews and
benchmarked incentivisation and compensation. In addition,
ongoing succession planning through a team-based
approach.
The Board also takes a keen interest in getting to know the
individuals through attendance at Board meetings and their
participation at the off-site Strategy meetings.
Loss of Key Personnel
L
oss of one or more of the investment management team,
particularly key individuals.
The Manager has a programme of visiting major institutional
holder
s and providing presentations via various platforms to
communicate more widely with its investors. Extensive range of
investor information and nation-wide presentations are done
by the Sales teams and feedback via brokers is reviewed for
improvements.
In addition, the Board arranges regular meetings with major
institutional holders and responds to questions and matters
raised at AGMs or in the interim by shareholders.
Shareholder Relations
F
ailure to communicate effectively and regularly and
appropriately with the different shareholder constituencies.
The Audit Committee receives independently audited reports
on the Manag
ers and other service providers’ internal controls,
as well as a report from the Manager’s Compliance function.
The Company’s management agreement obliges the Manager
to report on the detection of fraud relating to the Company’s
investments and the Company is afforded protection through
its various contracts with suppliers, of which one of the key
protections is the Depositary’s indemnification for loss or
misappropriation of the Company’s assets held in custody.
Details of how the Board monitors the services provided by
JPMF and its associates and the key elements designed to
provide effective risk management and internal control are
included within the Risk Management and Internal Control
section of the Corporate Governance Statement on page 49.
The Board is kept up to date with the Manager’s cyber security
defences and its cyber security programme. The information
technology controls around the physical security of data
centres, security of its networks and trading applications are
tested and reported on every.
Operational and Cyber Crime
In common with mos
t investment trusts the Board delegates
the operation of the business to third parties, the principal
delegate being the Manager.
Disruption to, failure of, or fraud in the Manager’s accounting,
dealing or payments systems or at its service providers
(Custodian, Depositary or Registrar) preventing timely
implementation of investment decisions, and potentially
shortfalls in the accuracy of reporting and monitoring of the
Company’s financial position.
Cyber attack impacting business continuity, breaches of
information security and integrity of data.
The Board relies on the services of its Company Secretary, the
Manag
er (JPMF) and its service providers and professional
advisers to ensure compliance. Relying on relevant processes
reviewed on a regular basis including by Internal Audit and Risk
& Operational audits together with regular consultation with
External Auditors and meetings of the Audit Committee.
Specifically, the Section 1158 compliance is continually
monitored by the Manager and the results reported to the
Board each month.
Accounting, Legal and Regulatory
F
ailure to comply with existing and emerging accounting, fiscal
regulatory rules. The Company operates in an environment with
significant regulation including the FCA Listing Rules, The UK
Companies Act, the Corporation Taxes Act, Market Abuse
Regulation, Disclosure Guidance and Transparency
Regulations and the Alternative Investment Fund Managers
Directive (AIFMD).
An example is the breach of Section 1158 which would lead to
aloss of investment trust status and, as a consequence, gains
within the Company’s portfolio would be subject to capital
gains tax.
European Discovery AR 02 Strategic Report p04-43.qxp 20/06/2024 09:47 Page 37

RISK & DESCRIPTION MITIGATION & MANAGEMENT
Artificial Intelligence (AI)
AI has become a powerful tool that will impact a huge range of
areas. It could be a significant driver for new business as well
as a disrupter to current business models and processes
leading to emerging uncertainty in corporate valuations. There
is also an increased potential risk from cyber related crime.
The Manager’s investment process integrates financially
ma
terial considerations of the impact of AI when taking
investment decisions.
The Board works with the Manager to monitor the
developments concerning AI and its potential impact on the
portfolio, our service providers and the wider market.
Climate Change
Clima
te change has an increasingly significant impact on the
business models, sustainability and even viability of individual
companies, sectors and asset classes, impacting investment
performance and valuations in the short and longer term.
The Manager’s investment process integrates financially
ma
terial considerations of environmental, social and
governance (ESG) factors when taking investment decisions.
This includes considering the approach investee companies
take to recognising and mitigating climate change risks.
This is outlined in Investment Manager’s Report.
The Board reviews ESG reports from the Manager on the way
ESG considerations are integrated into the investment decision
making.
It also considers, where relevant, the direct impact on climate
change from the nature of operations of the Manager and
other service providers. At the level of the Company, as extreme
weather events become more common, the resiliency,
business continuity planning and location strategies of the
Company’s service providers will come under greater scrutiny.
Principal and Emerging Risks
38 JPMorgan European Discovery Trust plc – Annual Report & Financial Statements 2024
Strategic Report
European Discovery AR 02 Strategic Report p04-43.qxp 20/06/2024 09:47 Page 38

Long Term Viability
J.P. Morgan Asset Management 39
Strategic Report
In the light of the Company’s current position, the principal
and emerging risks that it faces and their potential impact on
its future, the Directors have assessed the prospects of the
Company, to the extent that they are able to do so, over the
next five years. They have made that assessment by
considering the principal risks, the risk of breaching the
Company’s debt covenants as a result of a reduction in its
asset base, the Company’s investment objective and strategy,
the investment capabilities of the Manager and the current
outlook for the European economies and equity markets. The
Board has further considered the mitigation measures which
key service providers, including the Manager, have in place to
maintain operational resilience. In addition, the Company has
carried out stress testing in connection with the Company’s
stated principal risks, encompassing a number of scenarios
where the Company might be put under significant stress due
to market volatility or other exogenous shocks. This included
modelling the impact of substantial market falls, and testing
portfolio liquidity under stress. The scenarios assumed that
there would be no recovery in asset prices.
The results demonstrated the impact on the Company’s NAV,
its expenses, its debt levels and the covenants attached to
that debt as well as the Company’s ability to meet its liabilities.
In even the most stressed scenario, the Company was shown
to have sufficient cash, or to be able to liquidate a sufficient
portion of its listed holdings, in order to meet its liabilities as
they fall due.
Given the Company’s objective of achieving long term capital
growth, shareholders should consider the Company as a long
term investment proposition. This is consistent with advice
provided by investment advisers; that investors should
consider investing in equities for a minimum of five years.
Thus, the Directors consider five years to be an appropriate
time horizon to assess the Company’s viability.
The Directors confirm that they have a reasonable expectation
that the Company will be able to continue in operation and
meet its liabilities as they fall due over the five year period of
assessment.
European Discovery AR 02 Strategic Report p04-43.qxp 20/06/2024 09:47 Page 39

Section 172 of the Companies Act 2006 requires that a
Director must act in the way they consider, in good faith,
would be most likely to promote the success of the Company
for the benefit of its members (i.e. shareholders) as a whole
and in doing so, have regard (amongst other matters) to the
likely consequences of any decision in the long term; the
need to foster the Company’s business relationships with
suppliers, customers and others; the impact of the
Company’s operations on the community and the
environment; the desirability of the Company maintaining
areputation for high standards of business conduct; and the
need to act fairly as between members of the Company.
The Board is responsible for all decisions relating to the
Company’s investment objective and policies, gearing,
discount management, corporate governance and strategy,
and for monitoring the performance of the Company’s third
party service providers, including the Manager. The Board’s
philosophy is that the Company should foster a culture where
all the Company’s stakeholders are treated fairly and with
respect and the Board recognises the importance of acting
fairly between them, which is front of mind in its key decision
making. As an externally managed investment company with
no employees, the Board considers that the Company’s key
stakeholders are its shareholders, its Manager, its debt
providers, and its other professional third party service
providers (corporate broker, registrar, custodian and
depositary) and wider society. The Board believes the best
interests of the Company are aligned with those of these key
stakeholders as all parties wish to see and ultimately benefit
from the Company achieving its investment objectives whilst
carrying on business in compliance with the highest possible
regulatory, legal, ethical and commercial standards. As the
Company acts through its service providers, its culture is
represented by the values and behaviour of the Board and
third parties to which it delegates. The Board aims to fulfill the
Company’s investment objective by encouraging a culture of
constructive challenge with all key suppliers and openness
with all stakeholders. The Board is responsible for embedding
the Company’s culture in the Company’s operations. The
Board recognises the Company’s responsibilities with respect
to corporate and social responsibility and engages with its
service providers to safeguard the Company’s interests.
Aspart of this ongoing monitoring, the Directors will receive
regular reporting from service providers on matters such as
their anti-bribery and corruption policies; Modern Slavery
Act2015 statements; diversity policies; and greenhouse gas
and energy usage reporting. The Management Engagement
Committee reviews the Company’s service providers at least
annually.
The Company’s Business Model
The Board is appointed by the Company’s shareholders, who
also approve the Company’s investment objective. The Board
appoints the investment manager to deliver the investment
objective using its investment process. The Board oversees
the Company’s affairs by:
1. Ensuring the manager complies with the Investment
Guidelines (see page 33).
2. Reviewing the Manager’s performance against the
benchmark index and Key Performance Indicators (see
page34).
3. Using gearing where the expected benefits outweigh the
costs and risks (see page 42).
4. Monitoring the share price premium or discount and the
use of share issuances and buybacks (see page 42).
5. Setting the dividend policy and level of revenue reserve
(see page 42).
6. Monitoring the principal and emerging risks (see page 42).
7. Appointing and monitoring other third party service
providers, including the depository, registrar and broker.
8. Reviewing the Ongoing Charges Ratio (see page 35).
9. Ensuring compliance with governance codes and
regulatory requirements (see page 49.
10. Overseeing the marketing and investor relations activities
carried out by the Manager (see page 42).
Duty to Promote the Success of the Company
40 JPMorgan European Discovery Trust plc – Annual Report & Financial Statements 2024
Strategic Report
European Discovery AR 02 Strategic Report p04-43.qxp 20/06/2024 09:47 Page 40

Duty to Promote the Success of the Company
J.P. Morgan Asset Management 41
Strategic Report
Stakeholder Engagement
The following chart sets out the key stakeholders of the Company and how the Board engages with them.
The following sets out details of the Company’s engagement with its key stakeholders:
Shareholders
The Board aims to provide shareholders with a full understanding of the Company’s activities and performance. It reports
formally to shareholders twice a year by way of the Annual Report & Financial Statements and the Half Year Report. This is
supplemented by the daily publication, through the London Stock Exchange, of the net asset value (NAV) of the Company’s
shares. In addition, the Company issues announcements for all significant events and these are available on the Company’s
website together with monthly factsheets published by the Manager.
The Board regularly monitors the shareholder profile of the Company. It seeks regular engagement with the Company’s major
shareholders to understand their views on governance and performance against the Company’s investment objective and
investment policy. This is done by engaging in discussions on an ongoing basis, either directly or through the Company’s
brokers, the portfolio managers or JPMF. In addition the Chairman and other Directors make themselves available as and when
required to address any shareholder queries. The Directors may be contacted through the Company Secretary whose details
are shown on page 107.
The Annual General Meeting (AGM) provides the key forum for the Board and Portfolio Managers to present to shareholders on
the Company’s performance, future plans and prospects. It also allows shareholders the opportunity to meet with the Board
and Portfolio Managers to raise any questions or concerns. A recording of the Portfolio Managers’ presentation is also available
on the Company’s website following the AGM.
Manager
The Company’s principal supplier is the Manager, in particular the investment management team who are responsible for
managing the Company’s assets in order to achieve its stated investment objective. The Board maintains a good working
relationship with the Manager, who also provides administrative support and promotes the Company through its investment
trust sales and marketing teams.
Shareholders
JPMorgan European Discovery Trust
(Board of Directors appointed by the
shareholders)
Debt Providers
Investment Manager
Custodian
Broker
Lawyers
Registrar
Depositary
Administrative and Operational
Functions:
Secretarial, Accounting, Compliance
etc.
Third Party Service Providers
European Discovery AR 02 Strategic Report p04-43.qxp 20/06/2024 09:47 Page 41

The Board monitors the Company’s investment performance at each Board Meeting in relation to its objective and also to its
investment policy and strategy. The Board also maintains strong lines of communication with the Manager via its dedicated
company secretary and client director which extend well beyond the formal business addressed at Board meetings.
Investee companies
The Board is committed to responsible investing and actively monitors the activities of investee companies through its
delegation to the Manager. In order to achieve this, the Manager has discretionary powers to exercise voting rights on behalf of
the Company on all resolutions proposed by the investee companies.
In respect of the year under review, the Manager voted at the annual general meetings and extraordinary meetings held during
the year by the Company’s portfolio companies (full details can be found in the ESG report on page 30). The Board monitors
investments made and divested and where appropriate, seeks the rationale for exposures taken and voting decisions made.
Other Third Party Service Providers and Advisors
The Board ensures that it promotes the success of the Company by engaging specialist third party suppliers, with appropriate
capability, performance records, resources and controls in place to deliver the services that the Company requires for meeting
relevant obligations and safeguarding the Company’s assets. For this reason, the Board consider the Company’s Custodian,
Depositary, Registrar, Auditor and Broker to be stakeholders.
The Board maintains regular contact with its key external service providers, either directly, or via its dedicated company
secretary or client director, and receives regular reporting from these providers at Board and Committee meetings. The
Management Engagement Committee meets annually to review and appraise its key service providers.
Debt Providers
The Board, in discussion with the portfolio managers, regularly reviews the Company’s debt position. This process includes
identifying the need for finance, the type of finance and the parties to work with. This leads to pricing and term discussions
including covenants with the selected debt provider. The Company, through its Manager, maintains the relationship and
continued engagement with the debt providers which includes regular debt compliance reporting.
Key Decisions
The Directors confirm that they have considered their duty under Section 172 when making decisions during the financial year
under review. Some of the key decisions and actions during the year which have required the Directors to have regard to
applicable section 172 factors include:
Review of Investment Performance
During the year, the Board held of number of meetings with the Investment Manager to hold them to account for investment
performance. The Board also undertook an internal review of the portfolio management team. This led to Jon Ingram,
JackFeatherby and Jules Bloch being appointed as the named Portfolio Managers of the Company with effect from 1st March
2024, replacing Francesco Conte and Edward Greaves.
Re-appointment of Manager
The Directors have reviewed the competitiveness of the management fee and the Company’s other operating costs, held the
Manager to account for investment performance and encouraged the Manager to enhance its sales and marketing efforts.
Areview of the Manager and its services was undertaken during the year. Post the review process, the Board re-appointed the
Manager.
Share buybacks
The Board monitored the level of the discount during the year and actively used its ability to repurchase shares to minimise the
short-term volatility and the absolute level of the discount when appropriate. As a result during the year 9,782,472 shares were
repurchased, at a cost of £40.3 million representing 6.6% of the Company’s issued share capital.
Gearing and Borrowings
During the year, the Company renewed its loan facility with Scotiabank for a further period of two years. The facility is for
EUR125million and expires in March 2026.
Dividends Payable
The Board decided to recommend a final dividend of 8.0p per share, making a total of 10.5p per share to the shareholders for
the year 31st March 2024. This balances the Company’s investment objective to provide capital growth together with the value
placed by some investors on the receipt of a cash dividend.
Duty to Promote the Success of the Company
42 JPMorgan European Discovery Trust plc – Annual Report & Financial Statements 2024
Strategic Report
European Discovery AR 02 Strategic Report p04-43.qxp 20/06/2024 09:47 Page 42

Duty to Promote the Success of the Company
J.P. Morgan Asset Management 43
Strategic Report
Asset Reunification Programme
During the year, the Board considered and approved an asset reunification programme conducted by the Company’s registrar.
This aimed to identify shareholders for whom there were no current contact details. As a result, a total of seven shareholders
(20% of the total untraced and ‘gone away’ shareholders) were identified, enabling them to access unclaimed dividends and
shares valued, in total, at around £230,000.
Change of Registrar
As part of the regular review of its key service providers, the Company, through its Manager, undertook a review of its Registrar.
After a thorough RFP (request for proposals) and due diligence process by the Manager and consideration by the Board, it was
resolved to appoint Computershare. The Manager and the new Registrar have committed to ensure a smooth transition of the
Company’s shareholder register over the year. The shareholders will be notified via an RNS when the transition is complete.
Board Succession
Shareholder interests are best served by ensuring a smooth and orderly succession for the Board which serves to provide both
continuity and refreshment whilst ensuring diversity of both background and experience.
Details are provided in the Chairman's statement regarding the planned retirement of Nicholas Smith at the forthcoming AGM
in July 2024 and appointment of James Will with effect from the conclusion of that meeting.
Changes to UK sanctions law
The Economic Crime (Transparency and Enforcement) Act 2022 introduced a strict civil liability regime in the UK for companies
that breach sanctions legislation. A key implication is that any routine activities which involve making funds or economic
resources available to persons that are (directly or indirectly) interested in the Company’s shares – including the payment of
dividends, repurchases or issuance of shares – may now place the Company at risk of breaching sanctions legislation even
where the Company neither knew nor had reasonable cause to suspect this. During the year, in conjunction with the
Company’s registrars, the Board has taken specific and practical steps to mitigate this risk including a decision to undertake
an enhanced analysis of the shareholder register.
By order of the Board
Marc van Gelder
Chairman
19th June 2024
European Discovery AR 02 Strategic Report p04-43.qxp 20/06/2024 09:47 Page 43

Image:
Governance
European Discovery AR 03 Directors Report p44-60.qxp 20/06/2024 09:49 Page 44

Marc van Gelder (Chairman)
First appointed to the Board in August 2016.
Most recent reappointment was in 2023.
Marc has worked for over 30 years in business in Europe and is currently Chairman of the Supervisory Board of
Incision, Member of the Supervisory Board of Action Service & Distributie BV and Member of the Board of the
Netherland-America Foundation. His former roles include CEO of Mediq, a Dutch listed pharmaceutical distributor,
which was acquired by Advent in 2013 and President & CEO of Peapod, part of Ahold USA.
Connections with the Manager: None.
Shared Directorships with other Directors: None.
Nicholas Smith (Chairman of the Audit Committee and Remuneration Committee)
First appointed to the Board in May 2015.
Most recent reappointment was in 2023.
Nicholas is a Chartered Accountant and has had a long career in investment banking and has been on the boards of
anumber investment companies over the last two decades. He is currently the Chairman of Preyshot Estates Ltd. His
previous roles include being CFO of Jardine Fleming from 1993 to 1997.
Connections with the Manager: None.
Shared Directorships with other Directors: None.
Sarah Watters (Senior Independent Director)
First appointed to the Board in July 2021.
Most recent reappointment was in 2023.
Sarah Watters has extensive investment management experience gained over 25 years working for top tier institutions.
She is currently Executive Director at Bellecapital heading up UK Portfolio Management and also a member of the
Investment Committee of Churchill College at the University of Cambridge. Her recent roles include serving as the
Headof Equities, UK, Europe and Emerging Markets at BP Investment Management Ltd.
Connections with the Manager: None.
Shared Directorships with other Directors: None.
Suzy Ross
First appointed to the Board in March 2022.
Most recent reappointment was in 2023.
Suzy has deep expertise in marketing and customer centric strategy gained over some 20 years. Suzy’s current, full
time executive role is at Google Cloud where she is Global Director for Private Equity partnerships. Her previous roles
include Senior Retail Adviser to Accenture, Chief Customer Officer at Jaeger and Chief Marketing Officer at SpaceNK.
Connections with the Manager: None.
Shared Directorships with other Directors: None.
Arun Sarwal
First appointed to the Board in July 2023.
Arun is a Chartered Accountant and has broad experience of global equities and fund management over some
35years in the UK, Europe, and Asia. He has an understanding of the European business having worked in Amsterdam,
Dublin and Paris. His previous roles include CEO of Broadridge Fund Communication Solutions and DST Global
Solutions, COO at Scottish Widows Investment Partnership and global roles at ABN AMRO and Societe Generale.
Connections with the Manager: None.
Shared Directorships with other Directors: None.
All Directors are members of the Audit, Management Engagement, Nomination and Remuneration Committees and are considered by the Board
to be independent of the Manager.
Board of Directors
J.P. Morgan Asset Management 45
Governance
European Discovery AR 03 Directors Report p44-60.qxp 20/06/2024 09:49 Page 45

The Directors present their Annual Report & Financial Statements for the year ended 31st March 2024.
Management of the Company
The Manager and Company Secretary is JPMorgan Funds
Limited (‘JPMF’). JPMF is employed under a contract which
can be terminated on six months’ notice, without penalty. If
the Company wishes to terminate the contract on shorter
notice, the balance of remuneration is payable by way of
compensation. The active management of the Company’s
assets is delegated by JPMF to an affiliate, JPMorgan Asset
Management (UK) Limited (‘JPMAM’). The Manager is a wholly
owned subsidiary of JPMorgan Asset Management
International Limited which, together with the other
subsidiaries, provides accounting, banking, dealing and
custodian services to the Company.
A dedicated Company Secretary is nominated by JPMF to
service the Board.
The Management Engagement Committee conducts a formal
evaluation of the Manager on an annual basis. The evaluation
include a consideration of the management fees and whether
the service received represents value for money for
shareholders. The Committee has thoroughly reviewed the
performance of the Manager over the course of the year. The
review covered consideration of the investment strategy and
process of the Manager, resources and risk controls,
performance against the benchmark over the long term and
the quality of support that the Company received including
the marketing support provided. As a result of that process,
the Board confirms that it is satisfied that the continuing
appointment of the Manager is in the interests of
shareholders as a whole.
The Alternative Investment Fund Managers
Directive (‘AIFMD’)
JPMF is the Company’s alternative investment fund manager
(‘AIFM’). It is approved as an AIFM by the FCA. For the purposes
of the AIFMD the Company is an alternative investment fund
(‘AIF’). JPMF has delegated responsibility for the day- to-day
management of the Company’s portfolio to JPMAM. The
Company has appointed Bank of New York Mellon
(International) Limited (‘BNY’) as its depositary. BNY has
appointed JPMorgan Chase Bank, N.A. as the Company’s
custodian. BNY is responsible for the oversight of the custody
of the Company’s assets and for monitoring its cash flows.
The AIFMD requires certain information to be made available
to investors in AIFs before they invest and requires that
material changes to this information be disclosed in the
annual report of each AIF. An Investor Disclosure Document,
which sets out information on the Company’s investment
strategy and policies, leverage, risk, liquidity, administration,
management, fees, conflicts of interest and other
shareholder information is available on the Company’s
website at www.jpmeuropeandiscovery.co.uk
. There have
been no material changes (other than those reflected in these
financial statements) to this information requiring disclosure.
Any information requiring immediate disclosure pursuant to
the AIFMD will be disclosed to the London Stock Exchange
through a primary information provider.
JPMF’s remuneration disclosures are set out on page 92.
Management fee
With effect from 1st October 2023, the management fee has
been charged at the annual rate of 0.75% of the Company’s
net assets (until 30th September 2023, it was charged at
0.85% of the Company’s net assets). The fee is calculated and
paid monthly in arrears. An adjustment is made to exclude
from the calculation investments in funds on which the
Manager charges a management fee and therefore there is
no double charging of management fees on investment in
JPM funds.
Directors
All Directors of the Company who held office at the end of the
period under review are detailed on page 45. Details of their
beneficial shareholdings in the Company may be found in the
Directors’ Remuneration Report on page 57.
In accordance with corporate governance best practice, all
Directors, except Nicholas Smith, who will be retiring at the
forthcoming Annual General Meeting, will offer themselves for
re-appointment. The Board is satisfied that all Directors
remain independent from the Manager. The Nomination
Committee, having considered their qualifications,
performance and contribution to the Board and its
committees, confirms that each Director continues to be
effective and demonstrates commitment to the role and the
Board recommends to shareholders that they be
re-appointed.
Director indemnification and insurance
As permitted by the Company’s Articles of Association, each
Director has the benefit of an indemnity which is a qualifying
third party indemnity, as defined by Section 234 of the
Companies Act 2006. For the Directors who served during the
year under review, these indemnities were in place
throughout the year and remains in place at the date of this
report.
An insurance policy is maintained by the Company which
insures the Directors of the Company against certain
liabilities arising in the conduct of their duties. There is no
cover against fraudulent or dishonest actions.
Disclosure of information to auditor
In the case of persons who are Directors of the Company at
the time when this report was approved:
Directors’ Report
46 JPMorgan European Discovery Trust plc – Annual Report & Financial Statements 2024
Governance
European Discovery AR 03 Directors Report p44-60.qxp 20/06/2024 09:49 Page 46

(a) so far as each of the Directors is aware, there is no
relevant audit information (as defined in the Companies
Act) of which the Company’s Auditors are unaware, and
(b) each of the Directors has taken all the steps that he/she
ought to have taken as a Director in order to make
himself/herself aware of any relevant audit information
(as defined) and to establish that the Company’s Auditors
are aware of that information.
The above confirmation is given and should be interpreted in
accordance with the provision of Section 418(2) of the
Companies Act 2006.
Independent auditor
Ernst & Young LLP were appointed as Auditors in 2019 and
have expressed their willingness to continue in office as the
Auditors. A resolution to reappoint Ernst & Young LLP for the
ensuing year is being put to shareholders at the forthcoming
Annual General Meeting and to authorise the Directors to
determine their remuneration.
Total Return, Revenue and Dividends
Gross gain for the year amounted to £51.8 million (2023: Gross
loss £23.1 million) and net total gain after deducting the
management fee, other administrative expenses, finance
costs and taxation amounted to £39.6 million (2023: Net loss
£33.9 million). Net revenue return after taxation for the year
amounted to £18.7 million (2023: £17.5 million). An interim
dividend of 2.5p per share (2023: 1.2p) was paid during the
year, costing £3.8 million (2023: £1.9 million). The Directors
have proposed a final dividend of 8.0p (2023: 7.8p) per share.
This dividend will amount to £11.8 million and the total revenue
reserve will amount to £9.0 million after the payment of this
dividend. Further details are set out in note 72 to the financial
statements.
Share Repurchases
The Directors have authority on behalf of the Company to
repurchase shares in the market either for cancellation or into
Treasury and to sell Treasury shares or issue new Ordinary
shares for cash.
During the financial year, the Company repurchased 9,782,472
shares, for a total consideration of £40.3 million. Since the
year end, the Company has purchased 4,406,205 shares.
No shares were issued during the year or since the year end.
The rules concerning the appointment and replacement of
Directors, amendment of the Articles of Association and
powers to issue or repurchase the Company’s shares are
contained in the Articles of Association of the Company and
the Companies Act 2006.
There are no restrictions concerning the transfer of securities
in the Company; no special rights with regard to control
attached to securities; no agreements between holders of
securities regarding their transfer known to the Company; no
agreements which the Company is party to that affect its
control following a takeover bid; and no agreements between
the Company and its Directors concerning compensation for
loss of office.
Special Resolutions to renew the Company’s authorities to
issue and repurchase shares will be put to shareholders at
the forthcoming Annual General Meeting.
Voting Rights in the Company’s shares
Details of the voting rights in the Company’s shares as at the
latest practicable date are given in note 16 to the Notice of
Annual General Meeting on page 97.
Borrowings
The Company has a EUR 125 million unsecured loan facility
with Scotiabank. This agreement was renewed in March 2024
for a further two year term.
Notifiable Interests in the Company’s Voting
Rights
At the end of the financial year, the following had declared a
notifiable interest in the Company’s voting rights:
Number of % voting
Shareholders voting rights %
Allspring Global Investments
Holdings. 23,178,118 15.68
Saba Capital Management, L.P.
1
19,717,660 13.00
City of London Investment
Management Company Limited 17,727,746 11.26
JPMorgan Chase & Co. 7,585,232 5.13
1
Shares held through Total Return Swaps.
Listing rule 9.8.4R
Listing Rule 9.8.4R requires the Company to include certain
information in a single identifiable section of the Annual
Report or a cross reference table indicating where the
information is set out. The Directors confirm that there are no
disclosures to be made in this regard.
Directors’ Report
J.P. Morgan Asset Management 47
Governance
European Discovery AR 03 Directors Report p44-60.qxp 20/06/2024 09:49 Page 47

Annual General Meeting
NOTE: THIS SECTION IS IMPORTANT AND REQUIRES YOUR
IMMEDIATE ATTENTION. if you are in any doubt as to the action
you should take, you should seek your own personal financial
advice from your stockbroker, bank manager, solicitor or other
financial adviser authorised under the Financial Services and
Markets Act 2000.
Resolutions relating to the following items of special business
will be proposed at the forthcoming Annual General Meeting.
The full text of the resolutions is set out in the Notice of
Meeting on pages 97 to 100.
(i) Authority to allot new shares and to disapply statutory
pre-emption rights (Resolutions 10 and 11)
The Directors will seek renewal of the authority at the Annual
General Meeting to issue new ordinary shares for cash or by
way of a sale of Treasury shares up to an aggregate nominal
amount of £787,375, such amount being equivalent to
approximately 10% of the issued share capital (excluding
Treasury shares) as at the latest practicable date before the
publication of this document or, if different, the number of
ordinary shares which is equal to 10% of the Company’s
issued share capital (excluding Treasury shares) as at the
date of the passing of the resolution. This authority will expire
at the conclusion of the Annual General Meeting of the
Company in 2025 unless renewed at a prior general meeting.
Resolution 11 will enable the allotment of ordinary shares
otherwise than by way of a pro rata issue to existing
shareholders. It is advantageous for the Company to be able
to issue new shares (or to reissue shares from Treasury) to
investors when the Directors consider that it is in the best
interests of shareholders to do so. Any such issues would only
be made at prices greater than the net asset value (‘NAV’),
thereby increasing the NAV per share and spreading the
Company’s administrative expenses, other than the
management fee which is charged on the value of the
Company’s net assets, over a greater number of shares. The
issue proceeds would be available for investment in line with
the Company’s investment policies. No issue of shares will be
made which would effectively alter the control of the Company
without the prior approval of shareholders in a general
meeting.
(ii) Authority to repurchase the Company’s shares
(Resolution12)
The authority to repurchase up to 14.99% of the Company’s
issued share capital, granted by shareholders at the 2023
Annual General Meeting, will expire on 23rd January 2025
unless renewed at the forthcoming Annual General Meeting.
The Directors consider that the renewal of this authority is in
the interests of shareholders as a whole, as the repurchase of
shares at a discount to the underlying NAV enhances the NAV
of the remaining shares.
Resolution 12 gives the Company authority to repurchase its
own issued ordinary shares in the market as permitted by the
Companies Act 2006 (the ‘Act’). The authority limits the
number of shares that could be purchased to a maximum
number of ordinary shares, representing approximately
14.99% of the Company’s issued ordinary shares as at the
latest practicable date before the publication of this
document or, if less, the number of ordinary shares which is
equal to 14.99% of the Company’s issued share capital
(excluding Treasury shares) as at the date of the passing of
the resolution. The authority also sets minimum and
maximum prices.
If resolution 12 is passed at the Annual General Meeting, the
Board may repurchase the shares for cancellation or hold
them in Treasury pursuant to the authority granted to it for
possible reissue at a premium to NAV. Repurchases will be
made at the discretion of the Board and will only be made in
the market at prices below the prevailing NAV per share,
thereby enhancing the NAV of the remaining shares as and
when market conditions are appropriate. This authority will
expire in January 2026, or when the whole of the 14.99% has
been acquired, whichever is the earlier, however it is the
Board’s intention to seek renewal of the authority at the 2025
Annual General Meeting.
(iii) Resolution 13, which will be proposed as a special
resolution, seeks shareholder approval to call a general
meeting, other than an Annual General Meeting, on no less
than 14 clear days’ notice. The Company will only use the
shorter notice period where it is merited by the purpose of the
meeting.
Recommendation
The Board considers that Resolutions 1 to 13 are likely to
promote the success of the Company and are in the best
interests of the Company and its shareholders as a whole. The
Directors unanimously recommend that you vote in favour of
the resolutions as they intend to do, where voting rights are
exercisable, in respect of their own beneficial holdings which,
as at the year end, amounted in aggregate to 139,600 shares
representing less than 1% of the voting rights in the Company.
Directors’ Report
48 JPMorgan European Discovery Trust plc – Annual Report & Financial Statements 2024
Governance
European Discovery AR 03 Directors Report p44-60.qxp 20/06/2024 09:49 Page 48

Corporate governance statement
Compliance
During the year, the Company was subject to UK legislation
and regulations including UK company law, UK Financial
Reporting Standards, the UK Listing, Prospectus, Disclosure
Guidance and Transparency Rules, the Market Abuse
Regulation, taxation law and the Company’s own Articles of
Association. Since January 2021, new autonomous UK
regulations have been effective and the UK no longer applies
EU regulations.
The Company is an investment company within the meaning
of Section 833 of the Companies Act 2006 and has been
approved by HM Revenue & Customs as an investment trust
(for the purposes of Sections 1158 and 1159 of the Corporation
Tax Act 2010). As a result the Company is not liable for
taxation on capital gains. The Directors have no reason to
believe that approval will not continue to be retained. The
Company is not a close company for taxation purposes.
By virtue of the Company’s premium listing on the London
Stock Exchange, the Board is required to report on how the
principles of the 2018 UK Corporate Governance Code (the
‘UK Code’) have been applied. The 2019 Association of
Investment Companies Code of Corporate Governance (the
‘AIC Code’) addresses the principles and provisions of the
UKCode as well as additional provisions of specific relevance
to investment companies, and has been endorsed by the
Financial Reporting Council.
This enables investment company boards to report against
the AIC Code and still meet their obligations under the
UKCode and associated disclosure requirements under
paragraph 9.8.6 of the Listing Rules.
The Board has chosen to report under the AIC Code, as it
considers reporting against the AIC Code provides more
relevant information to the Company’s shareholders about its
governance arrangements. The Board has fully adopted the
recommendations of the 2019 AIC Code.
Copies of the UK Code and the AIC Code may be found on the
respective organisation’s websites: www.frc.org.uk
and
www.theaic.co.uk
.
In January 2024, the Financial Reporting Council updated the
UK Corporate Governance Code (‘Code’). This new Code will
apply to financial years beginning on or after 1st January
2025. The Company will consider the implications of this new
Code when it becomes effective.
Role of the Board
A management agreement between the Company and JPMF
sets out the matters which have been delegated to the
Manager. This includes management of the Company’s
assets and the provision of accounting, company secretarial,
administration and some marketing services. All other
matters are reserved for the approval of the Board. A formal
schedule of matters reserved to the Board for decision has
been approved. This includes the determination and
monitoring of the Company’s investment objectives and
policy and its future strategic direction, gearing policy,
management of the capital structure, appointment and
removal of third party service providers, review of key
investment and financial data and the Company’s corporate
governance and risk control arrangements.
At each Board meeting, Directors’ interests are considered.
These are reviewed carefully, taking into account the
circumstances surrounding them, and, if considered
appropriate, are approved. It was resolved that there were no
actual or indirect interests of a Director which conflicted with
the interests of the Company which arose during the year.
Following the introduction of The Bribery Act 2010, the Board
has adopted appropriate procedures designed to prevent
bribery. It confirms that the procedures have operated
effectively during the year under review.
The Board meets at least five times during the year and
additional meetings are arranged as necessary. Full and
timely information is provided to the Board to enable it to
function effectively and to allow Directors to discharge their
responsibilities.
There is an agreed procedure for Directors to take
independent professional advice, if necessary, at the
Company’s expense. This is in addition to the access that
every Director has to the advice and services of the Company
Secretary, who is responsible to the Board for ensuring that
Board procedures are followed and for compliance with
applicable rules and regulations.
Board composition
The Board, chaired by Marc van Gelder, currently comprises
five non-executive Directors, all of whom, including the
Chairman, are regarded by the Board as independent of the
Company’s Manager. The Directors have a breadth of
investment knowledge, business, marketing and financial
skills and experience relevant to the Company’s business.
Brief biographical details of each Director are set out on
page45.
During the year, as part of the Board succession planning
process, Trust Associates, a recruitment consultancy firm,
were appointed to undertake a non-executive director search.
After a short list for interview, the decision was made to
appoint James Will as a Director. His appointment will be
effective from the conclusion of the forthcoming Annual
General Meeting on 24th July 2024. Trust Associates has no
other connection with the Company.
A review of Board composition and balance is included as
part of the annual performance evaluation of the Board,
details of which may be found below. During the year,
MsSarah Watters took over the role of the Senior Independent
Director of the Company and in line with corporate
governance practice, she will lead the Chairman’s review and
Corporate Governance Statement
J.P. Morgan Asset Management 49
Governance
European Discovery AR 03 Directors Report p44-60.qxp 20/06/2024 09:49 Page 49

may be contacted by shareholders if they have concerns that
cannot be resolved through discussions with the Chairman.
Board Diversity
In terms of diversity, the current gender balance of three
menand two women Directors exceeds the target of 33%
ofwomen on FTSE 350 company boards set under The
Hampton-Alexander Review. The Board has also complied
with the recommendations of the Parker Review in respect of
board diversity. The FCA’s Listing Rules set diversity targets
and associated disclosure requirements for UK companies
listed on the premium and standard segment of the London
Stock Exchange. Listing Rule 9.8.6R (9) requires listed
companies to include a statement in their annual reports and
accounts in respect of certain targets on board diversity, or if
those targets have not been met to disclose the reasons for
this. This requirement applies to accounting periods
commencing on or after 1st April 2022 and the Company has
included the table below to report against these diversity
targets.
Diversity Table
1
Number of senior
positions on the Number in Percentage
Number of Percentage Board (CEO, CFO, executive of executive
Gender Board members of the Board SID and Chair) management management
Men 3 60 2 NA NA
Women 2 40 1 NA NA
Other Categories 0 0 0 NA NA
Not specified/prefer not to say NA NA NA NA NA
Ethnicity
2
White British (or any other
white background) 4 80 3 NA NA
Asian or Asian British 1 20 0 NA NA
1
Data as at 31st March 2024.
2
Categorisation of ethnicity is stated in accordance with the Office of National Statistics (‘ONS’) classification.
The information in the above table was provided by individual
Directors in response to a request from the Company. The
Company is pleased to report that, as at the date of approval
of this Annual Report, it meets FCA’s target on the below:
•
At least 40% of the board should be women.
•
At least one senior board position should be held by a
woman.
•
At least one member of the board should be from an ethnic
minority background, excluding white ethnic groups (using
ONS categories).
Reappointment of Directors
The Directors of the Company standing for re-appointment and
their brief biographical details are set out on page 45. The skills
and experience that each Director brings to the Board, and
hence why their contributions are considered important to the
long term success of the Company, are summarised below.
Resolution 5 relates to the reappointment of Marc van Gelder.
Marc has over 30 years working knowledge of European
business.
Resolution 6 relates to the reappointment of Sarah Watters.
Sarah has extensive investment management experience
gained over 25 years of having worked with top tier institution.
Resolution 7 relates to the reappointment of Suzy Ross. Suzy
has deep expertise of marketing and retail customer centric
strategy gained over some 20 years.
Resolution 8 relates to the appointment of Arun Sarwal. Arun is
a Charted Accountant and has broad experience of global
equities and fund management over some 35 years.
For details of current directorships of the Directors, please
refer to page 45.
Tenure
Directors are initially appointed until the following Annual
General Meeting when, under the Company’s Articles of
Association, it is required that they be appointed by
shareholders. Thereafter, subject to the performance
evaluation carried out each year, the Board will agree whether it
is appropriate for each Director to seek re-appointment. In
accordance with corporate governance best practice, Directors
Corporate Governance Statement
50 JPMorgan European Discovery Trust plc – Annual Report & Financial Statements 2024
Governance
European Discovery AR 03 Directors Report p44-60.qxp 20/06/2024 09:49 Page 50

continuing in office seek annual re-appointment and no
Director, including the Chair, will normally seek re-appointment
after having served for nine years on the Board unless there are
exceptional circumstances for doing so.
The Board does not believe that length of service in itself
necessarily disqualifies a Director from seeking
reappointment but, when making a recommendation, the
Board will take into account the requirements of the UK
Corporate Governance Code and the AIC Code, including the
need to refresh the Board and its Committees periodically.
As mentioned in the Chairman’s Statement, Nicholas Smith
will be retiring from the Board at this year’s AGM, having
served on the Board for more than nine years and James Will
will be appointed with effect from the conclusion of the
forthcoming Annual General Meeting on 24th July 2024.
The terms and conditions of Directors’ appointments are set
out in formal letters of appointment, copies of which are
available for inspection on request at the Company’s
registered office and at the Annual General Meeting.
A schedule of interests for each Director is maintained by the
Company and reviewed at every Board meeting. New interests
are considered carefully, taking into account the
circumstances surrounding them and, if considered
appropriate, are approved.
Induction and training
On appointment, the Manager and Company Secretary
provide all Directors with induction training. Thereafter,
regular briefings are provided on changes in law and
regulatory requirements that affect the Company and the
Directors. Directors are encouraged to attend industry and
other seminars covering issues and developments relevant to
investment trust companies. Regular reviews of the Directors’
training needs are carried out by the Chairman by means of
the evaluation process described on page 49.
Meetings and committees
The Board delegates certain responsibilities and functions to
Committees. Details of the membership of these Committees
are shown with the Directors’ profiles on page 45.
The table below details the number of formal Board and
Committee meetings attended by each Director. During the
year there were six Board meetings, three Audit Committee
meetings, one Management Engagement Committee
meeting, one Nomination and one Remuneration Committee
meeting. These meetings were supplemented by additional
meetings held to cover procedural matters and formal
approvals. There is also regular contact between the Directors
and the Manager and Company Secretary throughout the
year.
Meetings Attended
Management
Audit Engagement Remuneration Nomination
Director Board Committee Committee Committee Committee
Marc van Gelder 6 3 1 1 1
Nicholas Smith 6 3 1 1 1
Sarah Watters 6 3 1 1 1
Suzy Ross 6 3 1 1 1
Arun Sarwal
1
5 2 1 1 1
1
Appointed to the Board on 19th July 2023.
Board committees
The Nomination, Remuneration, Management Engagement
and Audit Committees have written terms of reference which
define clearly their respective responsibilities, and copies of
which are available on the Company’s website and for
inspection on request at the Company’s registered office and
at the Annual General Meeting.
Nomination committee
The Nomination Committee, currently chaired by Marc van
Gelder, consists of all Directors and meets at least annually.
The Nomination Committee reviews the composition,
structure and diversity of the Board, succession planning, the
independence of the Directors and whether each Director has
sufficient time available to discharge their duties effectively.
The Board’s policy on diversity, including gender, is to take
account this during the appointment process. The Board
remains committed to appointing the most appropriate
candidate and seeks to ensure that it does not unwittingly
exclude any group.
The Committee conducts an annual performance evaluation
of the Board, its committees and individual Directors to
ensure that all Directors have devoted sufficient time and
contributed adequately to the work of the Board and its
Committees. The evaluation of the Board also considers the
balance of experience, skills, independence, corporate
knowledge, its diversity, and how it works together. The
evaluation of the individual Directors is led by the Chairman
and the Senior Independent Director leads the evaluation of
the Chairman’s performance, which includes an appraisal of
his Board leadership and effectiveness in the role. During the
year, the Board undertook an externally facilitated board
evaluation using an independent advisory firm, Lintstock. The
evaluation was based on the collation and analysis of detailed
questionnaires completed by each Director and then
discussed by the Committee.
Having completed the annual evaluation process, the
Committee confirms that it believes that the Board and its
Committees have an appropriate balance of skills and
Corporate Governance Statement
J.P. Morgan Asset Management 51
Governance
European Discovery AR 03 Directors Report p44-60.qxp 20/06/2024 09:49 Page 51

experience, all Directors should be considered as
Independent in accordance with the provisions of the AIC
Code and all Directors have the time available to discharge
their duties effectively.
Remuneration Committee
The Board has established a Remuneration Committee for the
purpose of reviewing Directors’ fees. It makes
recommendations to the Board as and when appropriate, in
relation to remuneration policy and implementation. All
Directors are members of the Remuneration Committee and
the Chairman is Nicholas Smith. This role will be taken over by
Sarah Watters following Nicholas’s retirement at the
forthcoming AGM.
Management Engagement Committee
The membership of the Management Engagement Committee
consists of all independent Directors and is chaired by Marc
van Gelder. The Committee meets at least once a year to
review the terms of the management agreement between the
Company and the Manager, the performance of the Manager
and fees, the notice period that the Board has with the
Manager and to make recommendations to the Board on the
continued appointment of the Manager following these
reviews.
Audit committee
The Report of the Audit Committee is set out on pages 55
and56.
Annual General Meeting (‘AGM’)
As mentioned in the Chairman’s statement, this year’s Annual
General Meeting will be held on 24th July 2024 at 12.30p.m. at
60 Victoria Embankment, London EC4Y 0JP. Apart from the
formal business of the meeting, the shareholders will have the
opportunity to hear a presentation from our three portfolio
managers, Jon Ingram, Jack Featherby and Jules Bloch
followed by a question and answer session. Shareholders are
invited to attend the meeting and raise any questions they
have, either by asking questions at the meeting, or in advance
by writing to the Company Secretary at the address on
page107, or via email to invtrusts.cosec@jpmorgan.com
.
As is normal practice, all voting on the resolutions will be
conducted on a poll. The Board strongly encourages all
shareholders to exercise their votes by completing and
returning their proxy forms in accordance with the notes to
the Notice of Meeting on page 98.
The Company’s Annual Report and Financial Statements are
published in time to give shareholders at least 20 working
days’ notice of the Annual General Meeting. Shareholders
wishing to raise questions in advance of the meeting are
encouraged to do so via the Company’s website or write to the
Company Secretary at the address shown on page 107.
A formal process is in place for all letters to the Directors to be
immediately forwarded to them. As part of this process, any
other feedback from shareholders is also communicated to
the Board. Details of the proxy voting position on each
resolution will be published on the Company’s website shortly
after the Annual General Meeting.
Risk Management and Internal Control
The AIC Code requires the Directors to review the
effectiveness of the Company’s system of risk management
and internal control and to report this to shareholders at least
annually. This encompasses a review of all controls which the
Board has identified as relating to business, financial,
operational, compliance and risk management.
The Directors are responsible for the Company’s system of
risk management and internal control which is designed to
safeguard the Company’s assets, maintain proper
accounting records and ensure that financial information
used within the business or published is reliable. However,
such a system can only be designed to manage rather than
eliminate the risks entirely and therefore can only provide
reasonable, but not absolute, assurance against fraud,
material misstatement or loss.
Since investment management, custody of assets and all
administrative services are provided to the Company by the
Manager and its associates, the Company’s system of risk
management and internal control mainly comprises
monitoring the services provided by the Manager and its
associates, including the operating controls established to
ensure they meet the Company’s business objectives.
There is an ongoing process for identifying, evaluating and
managing the significant risks faced by the Company (see
Principal and Emerging Risks on pages 36 to 38). This process
has been in place for the year under review and up to the date
of the approval of the Annual Report and Financial
Statements, and it accords with the Financial Reporting
Council’s guidance. In common with most investment trust
companies, the Company does not have an internal audit
function of its own. The Manager’s internal audit department
conducts regular and rigorous reviews of the various
functions within its asset management business. Any
significant findings that are relevant to the Company and/or
the Manager’s investment trust business are reported to the
Board.
Corporate Governance Statement
52 JPMorgan European Discovery Trust plc – Annual Report & Financial Statements 2024
Governance
European Discovery AR 03 Directors Report p44-60.qxp 20/06/2024 09:49 Page 52

The key elements designed to provide effective internal
control are as follows:
•
Financial Reporting
Regular and comprehensive review by the Board of key
investment and financial data, including management
accounts, revenue projections, analysis of transactions
and performance comparisons.
• Information Technology Systems
The Manager and the Company’s other suppliers have
security systems in place to protect the Company’s
information. Information technology controls are tested
and reported on regularly by independent third parties.
•
Management Agreement
Evaluation and appointment of a manager and custodian,
regulated by the FCA, whose responsibilities are clearly
defined in documented agreements.
•
Management Systems
The Manager’s system of risk management and internal
control includes organisational agreements which clearly
define the lines of responsibility, delegated authority,
control procedures and systems. These are monitored by
the Manager’s Compliance department which regularly
monitors compliance with FCA rules.
•
Investment Strategy
Authorisation and monitoring of the Company’s investment
strategy and exposure limits by the Board.
The Board through the Audit Committee keeps under
review the effectiveness of the Company’s system of risk
management and internal control by monitoring the
operation of the key operating controls of the Manager and
its associates as follows:
– reviews the terms of the management agreement and
receives regular reports from the Manager’s
Compliance department;
– reviews reports on the risk management and internal
control and the operations of its Custodian, JPMorgan
Chase Bank, N.A., which is itself independently
reviewed; and
– reviews every six months an independent report on the
risk management and internal control and the
operations of the Manager.
By means of the procedures set out above, the Board
confirms that it has reviewed the effectiveness of the
Company’s system of risk management and internal control
for the year ended 31st March 2024 and to the date of approval
of this Annual Report and Financial Statements.
The Board confirms that any failings or weaknesses identified
during the course of its review of the system of risk
management and internal control were not significant and did
not materially affect the Company.
Employees, Social, Community, Environmental,
Human Rights Issues and Greenhouse Gas
Emissions
The Company has a management contract with JPMF. It has
no employees and all of its Directors are non-executive with all
the day-to-day activities being carried out by third parties.
There are therefore no disclosures to be made in respect of
employees.
The Board notes JPMAM’s global policy statements in respect
of Social, Community and Environmental and Human Rights
issues. More details on this can be found on page 105.
The Company also has no premises, consumes no electricity,
gas or diesel fuel and consequently does not have a
measurable carbon footprint and therefore qualifies as a low
energy user and is exempt from reporting under the
Streamlined Energy & Carbon Reporting requirements.
The Board’s policy is to offset the carbon emissions from any
air travel it undertakes on Company business. The Manager
arranges such travel for the Board, and has been offsetting
100% of air travel emissions from flights booked through its
travel agency since 2008.
Details on financially material Environmental, Social and
Governance considerations are included in the Manager’s
Investment Process on pages 19 to 22.
The Modern Slavery Act 2015 (the ‘MSA’)
The MSA requires companies to prepare a slavery and human
trafficking statement for each financial year of the
organisation.
As the Company has no employees and does not supply
goods and services, the MSA does not apply directly to it. The
MSA requirements more appropriately relate to JPMF and
JPMAM.
More information can be found on page 105.
Criminal Corporate Offence
The Company maintains zero tolerance towards tax evasion.
Shares in the Company are purchased through
intermediaries or brokers, therefore no funds flow directly into
the Company.
Corporate Governance Statement
J.P. Morgan Asset Management 53
Governance
European Discovery AR 03 Directors Report p44-60.qxp 20/06/2024 09:49 Page 53

Corporate Governance and Voting Policy
The Company delegates responsibility for voting to JPMAM
through the Manager. JPMAM’s policy statements on
corporate governance, voting policy and social and
environmental issues has been reviewed and noted by the
Board and can be found on page 105.
By order of the Board
Priyanka Vijay Anand, for and on behalf of
JPMorgan Funds Limited
Secretary
19th June 2024
54 JPMorgan European Discovery Trust plc – Annual Report & Financial Statements 2024
Governance
Corporate Governance Statement
European Discovery AR 03 Directors Report p44-60.qxp 20/06/2024 09:49 Page 54

Audit Committee Report
I am pleased to present my formal report to shareholders as
chairman of the Audit Committee for the year ended
31stMarch 2024.
Composition
Membership of the Audit Committee consists of all the
Directors and the Committee meets at least three times each
year. The members of the Audit Committee consider that they
have the requisite skills and experience to fulfil the
responsibilities of the Audit Committee and have a
combination of financial, investment and other experience
gained throughout their careers. Given the size of the Board, it
has been determined that the Chairman of the Board, Marc
van Gelder should be amember of the Audit Committee. This
is permitted under the AIC Code because the Chairman was
deemed to be independent on appointment. As a Chartered
Accountant, Ihave recent and relevant experience, and the
Committee as a whole has competence relevant to the sector.
Role and Responsibility
The Committee is responsible for monitoring and reviewing
the principles, policies and practices adopted in the
preparation and audit of the accounts of the Company and
the integrity of the financial statements. The Committee is
also responsible for monitoring the effectiveness of the
internal controls and the risk management framework. The
Audit Committee reviews the actions and judgements of the
Manager in relation to the Half Year and Annual Report and
Financial Statements and the Company’s compliance with the
AIC Code.
The Audit Committee keeps under review its Terms of
Reference and recommends any necessary changes to the
Board.
Financial Statements and Significant
Accounting Matters
During its review of the Company’s financial statements for
the year ended 31st March 2024, the Audit Committee
considered the following significant issues, including those
communicated by the Auditors during their reporting:
Significant issue How the issue was addressed
The valuation of investments and
derivatives are undertaken in
accordance with the accounting policies,
disclosed in note 1(b) and (g) to the
accounts on pages 73 and 74. 100% of the
portfolio can be verified against daily
published prices. Controls are in place to
ensure valuations are appropriate and
existence is verified through custodian
and depositary reconciliations. The
Board monitors controls and significant
movements in the underlying portfolio by
reviewing reports regularly in Board
Meetings.
The recognition of investment income is
undertaken in accordance with
accounting policy note 1(d) to the
financial statements on page 73. The
Board regularly reviews subjective
elements of income such as special
dividends and agrees their accounting
treatment.
Approval for the Company as an
investment trust under Sections 1158 and
1159 for financial years commencing on
or after 1st April 2013 has been obtained
and ongoing compliance with the
eligibility criteria is monitored on a
regular basis.
The Audit Committee has reviewed the
appropriateness of the adoption of the
Going Concern basis in preparing the
financial statements. The Audit
Committee recommended that the
adoption of the Going Concern basis is
appropriate (see Going Concern
statement on page below).
The Audit Committee also assessed the
Long Term Viability of the Company and
recommended to the Board its
expectation that the Company would
remain in operation for the five year
period of the assessment.
The Board is required to be made fully aware of any significant
financial reporting issues and judgements made in
connection with the preparation of the Financial Statements.
Valuation,
existence and
ownership of
investments
Recognition of
inves
tment income
Compliance
with S
ections
1158 and 1159 of
the Corporation
Tax Act 2010
Going Concern/
L
ong Term Viability
J.P. Morgan Asset Management 55
Governance
Audit Committee Report
European Discovery AR 03 Directors Report p44-60.qxp 20/06/2024 09:49 Page 55

Going Concern
In accordance with The Financial Reporting Council’s
guidance on going concern and liquidity risk, the Directors
have undertaken a rigorous review of the Company’s ability to
continue as a going concern. The Board has, in particular,
considered the impact of market volatility arising from
geopolitical risks, including the crisis in Ukraine and Russia
and the Middle East, and does not believe the Company’s
going concern status is affected. The Company’s assets, the
vast majority of which are investments in quoted securities
which are readily realisable, exceed its liabilities significantly
under all stress test scenarios reviewed by the Board. Gearing
levels and compliance with borrowing covenants are reviewed
by the Board on a regular basis. The Directors have also
assessed the ability of the Company to repay the amount
drawn down under its revolving credit facility, which expires in
March 2026, and are satisfied as to its ability to do so on
account of the ability of the Company to raise new finance via
loans or share issuances, or alternatively through the
realisation of investments in the Company’s liquid quoted
securities. Furthermore, the Directors are satisfied that the
Company’s key third party service providers have in place
appropriate business continuity plans to ensure their
operational resilience and the performance of these service
providers is reviewed at least annually by the Management
Engagement Committee.
In preparing the financial statements, the Directors have
reviewed the Company’s ability to continue operating as
agoing concern. This review took into consideration the
principal and emerging risks described on pages 36 to 38.
Accordingly, the financial statements have been prepared on
the going concern basis as it is the Directors’ reasonable
expectation that the Company has adequate resources to
continue in operational existence for a period of at least
12months from the date of approval of these financial
statements. The Company’s longer-term viability is
considered in the Viability Statement on page 39.
Risk and Internal Control
The Audit Committee also examines the effectiveness of the
Company’s internal control systems and receives information
from the Manager’s compliance department. The Directors’
statement on the Company’s system of Risk Management and
Internal Control is set out on page 52. The Audit Committee
also reviews the scope and results of the external audit, its
cost effectiveness, the balance of audit and non-audit
services and the independence and objectivity of the external
Auditors. In the Directors’ opinion the Auditors are
independent.
The Audit Committee considers the key risks facing the
Company and the adequacy and effectiveness of the risk
management process.
The Company is in Compliance with the provisions of ‘The
Statutory Audit Services for Large Companies Market
Investigation’ (Mandatory Use of Competitive Tender
Processes and Audit Committee Responsibilities) Order 2014
as issued by the Competition & Markets Authority.
Auditor Appointment and Tenure
The Audit Committee also has a primary responsibility for
making recommendations to the Board on the reappointment
and removal of external Auditors. Representatives of the
Company’s Auditors attend the Audit Committee meeting at
which the draft Annual Report and Financial Statements are
considered and also engage with the Directors as and when
required.
As part of its review of the continuing appointment of the
Auditors, the Audit Committee considered the length of tenure
of the audit firm, its fee, its quality of service and its
independence from JPMF and the Investment Managers and
any matters raised during the audit.
A formal tender exercise was undertaken in 2019, as a result of
which Ernst & Young LLP was appointed in place of
PricewaterhouseCoopers LLP. This is the Audit Partner’s
(Caroline Mercer) fifth of a five year maximum term.
MikeGaylor will be the Company’s new audit partner. Details
of the fees paid for audit services are included in note6 on
page 76.
Provision on non-audit services
The Board reviews and approves any non-audit services
provided by the independent Auditors and assesses the impact
of any non-audit work on the ability of the Auditors to remain
independent. No such work was undertaken during the year.
Fair, Balanced and Understandable
The Audit Committee has considered all available information
and discussed the content of the Annual Report and Financial
Statements with the AIFM, the Investment Managers, the
Company Secretary and other third party service providers.
On this basis the Audit Committee has concluded that the
Annual Report and Financial Statements for the year ended
31st March 2024, taken as a whole, is fair, balanced and
understandable. It provides the information necessary for
shareholders to assess the Company’s performance,
business model and strategy and has reported on any
findings to the Board. The Board’s conclusions in this respect
are set out in the Statement of Directors’ Responsibilities on
page 60.
Nicholas Smith
Audit Committee Chairman
19th June 2024
Audit Committee Report
56 JPMorgan European Discovery Trust plc – Annual Report & Financial Statements 2024
Governance
European Discovery AR 03 Directors Report p44-60.qxp 20/06/2024 09:49 Page 56

Directors’ Remuneration Report
The Board presents the Directors’ Remuneration Report for
the year ended 31st March 2024 which has been prepared in
accordance with the requirements of Section 421 of the
Companies Act 2006 as amended.
The law requires the Company’s Auditors to audit certain
disclosures provided. Where disclosures have been audited
they are indicated as such. The Auditors’ opinion is included
in their report on pages 62 to 67.
Directors’ Remuneration Policy
The Directors’ Remuneration Policy is subject to a triennial
binding vote. However, the Board has decided to seek binding
approval annually, and therefore an ordinary resolution to
approve this policy will be put to shareholders at the
forthcoming Annual General Meeting. The policy subject to
the vote is set out in full below and is currently in force.
The Board’s policy for this and subsequent years is that
Directors’ fees should properly reflect the time spent by the
Directors on the Company’s business and should be at a level
to ensure that candidates of a high calibre are recruited to the
Board and retained. The Chairman of the Board and the
Chairman of the Audit Committee are paid higher fees than
the other Directors, reflecting the greater time commitment
involved in fulfilling those roles.
The Remuneration Committee, comprising all Directors,
reviews fees on a regular basis and makes recommendations
to the Board as and when appropriate. Reviews are based on
information provided by the Manager, and includes research
carried out by third parties on the level of fees paid to the
Directors of the Company’s peers and within the investment
trust industry generally. The involvement of remuneration
consultants has not been deemed necessary as part of this
review.
All of the Directors are non-executive. There are no
performance-related elements to their fees and the Company
does not operate any type of incentive, share scheme, award
or pension scheme and therefore no Directors receive bonus
payments or pension contributions from the Company or hold
options to acquire shares in the Company. Directors are not
granted exit payments and are not provided with
compensation for loss of office. No other payments are made
to Directors, other than the reimbursement of reasonable
out-of-pocket expenses.
In the year under review, Directors’ fees were paid at the
following rates: Chairman £46,500; Chairman of the Audit
Committee £38,250; and other Directors £31,000. With effect
from 1st April 2024, the fees have been increased to the
following rates: Chairman £48,500; Chairman of the Audit
Committee £40,000; and other Directors £32,500.
The Company’s Articles of Association provide that any
increase in the maximum aggregate annual limit on Directors’
fees, currently £225,000, requires both Board and
shareholder approval. The Directors have not proposed an
increase to this level.
The Company has no Chief Executive Officer and no
employees. Therefore, no consultation with employees is
required and nor is there any employee comparative data to
provide in relation to the setting of the remuneration policy for
Directors.
The Company has not sought shareholder views on its
remuneration policy. The Remuneration Committee considers
any comments received from shareholders on remuneration
policy on an ongoing basis and takes account of those views.
The terms and conditions of Directors’ appointments are set
out in formal letters of appointment which are available for
review at the Company’s Annual General Meeting and the
Company’s registered office. Details of the Board’s policy on
tenure are set out on page 50.
Directors’ Remuneration Policy Implementation
The Directors’ Remuneration Report, which includes details of
the Directors’ remuneration policy and its implementation, is
subject to an annual advisory vote and therefore an ordinary
resolution to approve this report will be put to shareholders at
the forthcoming Annual General Meeting. There have been no
changes to the policy compared with the year ended
31stMarch 2023 and no changes are proposed for the year
ending 31st March 2025.
At the Annual General Meeting held on 19th July 2023, of votes
cast in respect of the Remuneration Policy, 99% were in favour
(or granted discretion to the Chairman who voted in favour)
and less than 1% were against. Abstentions were received
from less than 1% of the votes cast. Of the votes cast in
respect of the Remuneration Report, 99% were in favour (or
granted discretion to the Chairman who voted in favour) and
less than 1% were against. Abstentions were received from
less than 1% of the votes cast.
Details of the implementation of the Company’s remuneration
policy are given below.
Single total figure of remuneration
The single total figure of remuneration for each Director is
detailed below together with the prior year comparative.
Directors’ Remuneration Report
J.P. Morgan Asset Management 57
Governance
European Discovery AR 03 Directors Report p44-60.qxp 20/06/2024 09:49 Page 57

Single total figure table
1
2024 2023
Taxable Taxable
Fees expenses
2
Total Fees expenses
2
Total
Directors’ Name £ £ £ £ £ £
Marc van Gelder 46,500 — 46,500 45,000 — 45,000
Nicholas Smith 38,250 404 38,654 37,000 — 37,000
Sarah Watters 31,000 56 31,056 30,000 — 30,000
Suzy Ross 31,000 — 31,000 30,000 220 30,220
Arun Sarwal
4
21,649 — 21,649 — — —
Ashok Gupta
3
9,351 — 9,351 30,000 — 30,000
Total 177,750 460 178,210 172,000 220 172,220
1
Audited information. Other subject headings for the single figure table as prescribed by regulation are not included because there is nothing to disclose in relation
thereto.
2
Taxable travel and subsistence expenses incurred in attending Board and Committee meetings (gross, including tax and NI).
3
Retired on 19th July 2023.
4
Appointed on 19th July 2023.
A table showing the total remuneration for the Chairman over
the five years ended 31st March 2024 is below:
Remuneration for the Chairman over the
fiveyears ended 31st March 2024
Year ended
31st March Fees
2024 £46,500
2023 £45,000
2022 £43,000
2021 £42,000
2020 £40,500
Directors’ Shareholdings
There are no requirements pursuant to the Company’s
Articles of Association for the Directors to own shares in the
Company. The beneficial shareholdings of the Directors who
held office at the year end are detailed below.
1st April
1
2023
31st March
1
or date of
Directors 2024 appointment
Marc van Gelder 110,000 80,000
Nicholas Smith 11,600 11,600
Sarah Watters 5,000 5,000
Suzy Ross 3,000 Nil
Arun Sarwal
2
10,000 Nil
1
Audited information.
2
Appointed on 19th July 2023.
As at the latest practicable date before the publication of this
document, there have been no other changes to the
Directors’ shareholdings.
The Directors have no other share interests or share options
in the Company and no share schemes are available.
Directors’ Remuneration Report
Governance
58 JPMorgan European Discovery Trust plc – Annual Report & Financial Statements 2024
European Discovery AR 03 Directors Report p44-60.qxp 20/06/2024 09:49 Page 58
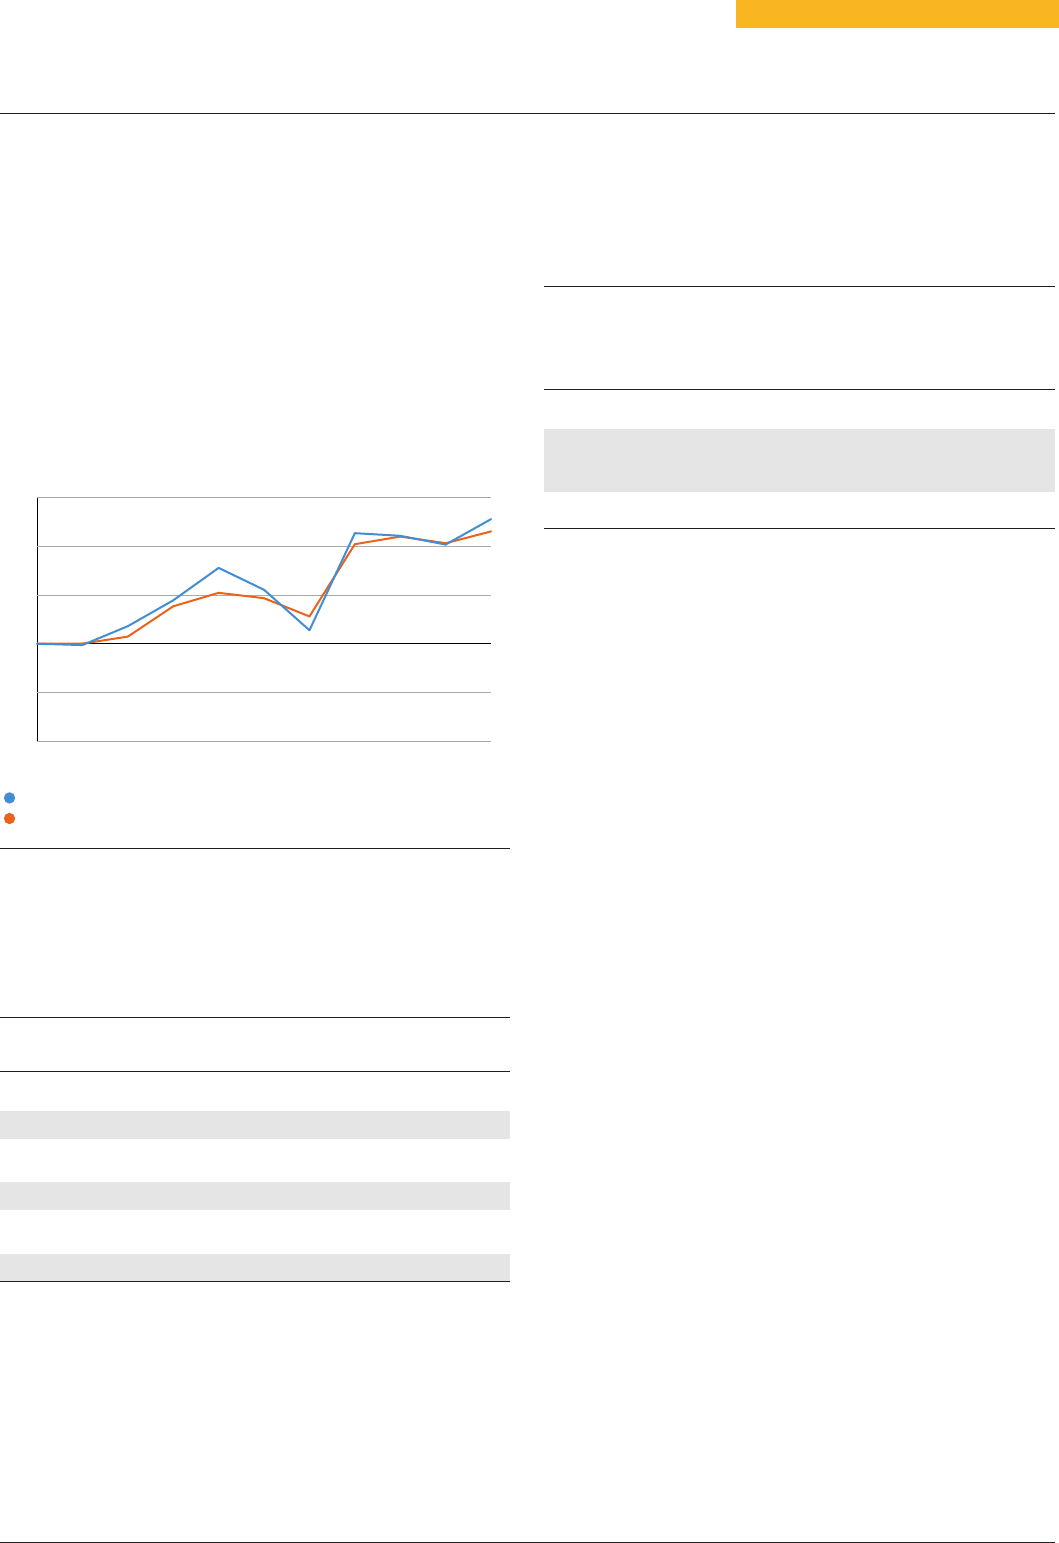
In accordance with the Companies Act 2006, a graph showing
the Company’s share price total return compared with its
benchmark, (until 31st March 2020 the Euromoney Smaller
European Companies (ex UK) Index), over the last ten years is
shown below. The Board believes that the current benchmark
of the Company; the MSCI Europe (ex UK) Small Cap Net Total
Return Index (the ‘Index’) is the most representative
comparator for the Company, because the Company’s
investment universe is defined at the time of purchase by the
countries and market capitalisation range of the constituents
of the Index.
Ten Year Share Price and Benchmark Total
Return Performance to 31st March 2024
Source: Morningstar/Euromoney.
Annual Percentage Change in Directors’
Remuneration
The following table sets out the annual percentage change in
Directors’ fees for the last three financial years:
% change for the year to 31st March
Directors’ Name 2024 2023 2022 2021
Ashok Gupta
1
NA 5% 4% 4%
Marc van Gelder 3% 5% 2% 15%
Nicholas Smith 3% 6% 3% 5%
Sarah Watters
2
3% NA NA NA
Suzy Ross
3
3% NA NA NA
Arun Sarwal
4
NA NA NA NA
1
Retired on 19th July 2023.
2
As Sarah Watters was appointed on 1st July 2021, the fees paid in 2022 was
not representative of the full year, hence the percentage increase on directors
fees paid would not be meaningful for 2022 and 2023 and is therefore shown
as NA. On a full year basis, the increase is 5%.
3
As Suzy Ross was appointed on 1st March 2022, the directors fees paid in
2022 was not representative of the full year, hence the percentage increase
on directors fees paid would not be meaningful and is shown as NA. On a full
year basis, the increase is 5%.
4
Appointed to the Board on 19th July 2023.
A table showing actual expenditure by the Company on
remuneration and distributions to shareholders for the year
and the prior year is below:
Expenditure by the Company on remuneration
and distribution to shareholders
Year ended
31st March
2024 2023
£ £
Remuneration paid to all Directors 178,240 172,220
Distribution to shareholders
— by way of dividends paid 15,976,000
1
10,551,000
— by way of share repurchases 40,278,000 4,254,000
1
Net of unclaimed dividends returned to the Company of £120,000.
For and on behalf of the Board
Nicholas Smith
Remuneration Committee Chairman
19th June 2024
0
50
100
150
200
250
20242023202220212020201920182017201620152014
Share price total return
Benchmark total return
J.P. Morgan Asset Management 59
Directors’ Remuneration Report
Governance
European Discovery AR 03 Directors Report p44-60.qxp 20/06/2024 09:49 Page 59

The Directors are responsible for preparing the Annual Report
and Accounts in accordance with applicable law and
regulations.
Company law requires the Directors to prepare financial
statements for each financial year. Under that law, the
Directors have elected to prepare the financial statements in
accordance with United Kingdom Generally Accepted
Accounting Practice (United Kingdom Accounting Standards
and applicable law). Under company law the Directors must
not approve the financial statements unless they are satisfied
that, taken as a whole, the Annual Report and Accounts are
fair, balanced and understandable, provide the information
necessary for shareholders to assess the Company’s position
and performance, business model and strategy and that they
give a true and fair view of the state of affairs of the Company
and of the total return or loss of the Company for that period.
In order to provide these confirmations, and in preparing
these financial statements, the Directors are required to:
• select suitable accounting policies and then apply them
consistently;
• make judgements and accounting estimates that are
reasonable and prudent;
• state whether applicable UK Accounting Standards have
been followed, subject to any material departures
disclosed and explained in the financial statements; and
• prepare the financial statements on a going concern basis
unless it is inappropriate to presume that the Company will
continue in business
and the Directors confirm that they have done so.
The Directors are responsible for keeping proper accounting
records that are sufficient to show and explain the
Company’s transactions and disclose with reasonable
accuracy at any time the financial position of the Company
and to enable them to ensure that the financial statements
comply with the Companies Act 2006. They are also
responsible for safeguarding the assets of the Company and
hence for taking reasonable steps for the prevention and
detection of fraud and other irregularities.
The financial statements are published on the
www.jpmeuropeandiscovery.co.uk
website, which is
maintained by the Company’s Manager. The maintenance
and integrity of the website maintained by the Manager is, so
far as it relates to the Company, the responsibility of the
Manager. The work carried out by the Auditors does not
involve consideration of the maintenance and integrity of this
website and, accordingly, the Auditors accept no
responsibility for any changes that have occurred to the
financial statements since they were initially presented on the
website. The financial statements are prepared in
accordance with UK legislation, which may differ from
legislation in other jurisdictions.
Under applicable law and regulations the Directors are also
responsible for preparing a Directors’ Report, Strategic
Report, Statement of Corporate Governance and Directors’
Remuneration Report that comply with that law and those
regulations.
Each Director, whose names and functions are listed on
page45 confirm that, to the best of their knowledge:
• the financial statements, which have been prepared in
accordance with United Kingdom Generally Accepted
Accounting Practice (United Kingdom Accounting
Standards and applicable law), give a true and fair view of
the assets, liabilities, financial position and return or loss of
the Company; and
• the Strategic Report includes a fair review of the
development and performance of the business and the
position of the Company, together with a description of the
principal risks and uncertainties that it faces.
The Board confirms that it is satisfied that the Annual Report
and Financial Statements taken as a whole are fair, balanced
and understandable and provide the information necessary
for shareholders to assess the strategy and business model
of the Company.
For and on behalf of the Board
Marc Van Gelder
Chairman
19th June 2024
Statement of Directors’ Responsibilities
60 JPMorgan European Discovery Trust plc – Annual Report & Financial Statements 2024
Governance
European Discovery AR 03 Directors Report p44-60.qxp 20/06/2024 09:49 Page 60

Image:
Independent Auditor’s Report
European Discovery AR 04 Independent Auditors Report p61-67.qxp 20/06/2024 09:50 Page 61

Independent Auditor’s Report
62 JPMorgan European Discovery Trust plc – Annual Report & Financial Statements 2024
Independent Auditor’s Report
Independent auditor’s report to the members of JPMorgan European Discovery Trust Plc
Opinion
We have audited the financial statements of JPMorgan
European Discovery Trust Plc (‘the Company’) for the year
ended 31st March 2024 which comprise the Statement of
Comprehensive Income, Statement of Changes in Equity,
Statement of Financial Position, Statement of Cash Flows, and
the related notes1 to 24, including a summary of significant
accounting policies. The financial reporting framework that
has been applied in their preparation is applicable law and
United Kingdom Accounting Standards including FRS 102
‘TheFinancial Reporting Standard applicable in the UK and
Republic of Ireland’ (United Kingdom Generally Accepted
Accounting Practice).
In our opinion, the financial statements:
•
give a true and fair view of the company’s affairs as at
31stMarch 2024 and of its profit for the year then ended;
•
have been properly prepared in accordance with United
Kingdom Generally Accepted Accounting Practice; and
•
have been prepared in accordance with the requirements
of the Companies Act 2006.
Basis for opinion
We conducted our audit in accordance with International
Standards on Auditing (UK) (ISAs (UK)) and applicable law. Our
responsibilities under those standards are further described
in the Auditor’s responsibilities for the audit of the financial
statements section of our report. We believe that the audit
evidence we have obtained is sufficient and appropriate to
provide a basis for our opinion.
Independence
We are independent of the company in accordance with the
ethical requirements that are relevant to our audit of the
financial statements in the UK, including the FRC’s Ethical
Standard as applied to public interest entities, and we have
fulfilled our other ethical responsibilities in accordance with
these requirements.
The non-audit services prohibited by the FRC’s Ethical
Standard were not provided to the Company and we remain
independent of company in conducting the audit.
Conclusions relating to going concern
In auditing the financial statements, we have concluded that
the directors’ use of the going concern basis of accounting in
the preparation of the financial statements is appropriate. Our
evaluation of the directors’ assessment of the Company’s
ability to continue to adopt the going concern basis of
accounting included the following procedures:
• Confirmation of our understanding of the Company’s
going concern assessment process and discussed with
the Directors and the Company Secretary those factors
they considered important in their assessment.
• Inspection of the Directors’ assessment of going concern,
including the revenue forecast, for the period to 30th June
2025 which is at least 12 months from the date these
financial statements were authorised for issue. In
preparing the revenue forecast, the Company has
concluded that it is able to continue to meet its ongoing
costs as they fall due.
• Review of the factors and assumptions, including the
impact of the current economic environment and other
significant events that could give rise to market volatility,
as applied to the revenue forecast and the liquidity
assessment of the investments and determined, through
testing of the methodology and calculations, that the
methods, inputs and assumptions utilised are appropriate
to be able to make an assessment for the Company.
• Assessment of the risk of breaching the debt covenants as
a result of a reduction in the value of the Company’s
portfolio. We calculated the Company’s compliance with
debt covenants and performed reverse stress testing in
order to identify what factors would lead to the Company
breaching the debt covenants.
• Consideration of the mitigating factors included in the
revenue forecasts that are within the control of the
Company. We reviewed the Company’s assessment of the
liquidity of investments held and evaluated the Company’s
ability to sell those investments in order to cover working
capital requirements should revenue decline significantly.
• Review of the Company’s going concern disclosures
included in the annual report in order to assess that the
disclosures were consistent with the financial statements
and our understanding of the Company and in conformity
with the reporting standards.
Based on the work we have performed, we have not identified
any material uncertainties relating to events or conditions
that, individually or collectively, may cast significant doubt on
the Company’s ability to continue as a going concern for
aperiod assessed by the Directors, being the period to
30thJune 2025 which is at least 12 months from when these
financial statements are authorised for issue.
In relation to the Company’s reporting on how they have
applied the UK Corporate Governance Code, we have nothing
material to add or draw attention to in relation to the Directors’
statement in the financial statements about whether the
Directors considered it appropriate to adopt the going
concern basis of accounting.
Our responsibilities and the responsibilities of the Directors
with respect to going concern are described in the relevant
sections of this report. However, because not all future events
or conditions can be predicted, this statement is not a
guarantee as to the Company’s ability to continue as a going
concern.
European Discovery AR 04 Independent Auditors Report p61-67.qxp 20/06/2024 09:50 Page 62

Independent Auditor’s Report
J.P. Morgan Asset Management 63
Independent Auditor’s Report
Overview of our audit approach
Key audit matters • Risk of incomplete or inaccurate revenue recognition, including the classification of special
dividends as revenue or capital items in the Statement of Comprehensive Income.
• Risk of incorrect valuation or ownership of the investment portfolio.
Materiality • Overall materiality of £7.69million which represents 1% of shareholders’ funds.
An overview of the scope of our audit
Tailoring the scope
Our assessment of audit risk, our evaluation of materiality and our allocation of performance materiality determine our audit scope
for the Company. This enables us to form an opinion on the financial statements. We take into account size, risk profile, the
organisation of the Company and effectiveness of controls, the potential impact of climate change and changes in the business
environment when assessing the level of work to be performed. All audit work was performed directly by the audit engagement team.
Climate change
Stakeholders are increasingly interested in how climate change will impact companies. The Company has determined that the
most significant future impacts from climate change on its operations will be from how climate change could affect the
Company’s investments and overall investment process. This is explained on page 38 in the principal and emerging risks
section. This disclosure forms part of the ‘Other information,’ rather than the audited financial statements. Our procedures on
these unaudited disclosures therefore consisted solely of considering whether they are materially inconsistent with the financial
statements or our knowledge obtained in the course of the audit or otherwise appear to be materially misstated, in line with our
responsibilities on ‘Other information’.
Our audit effort in considering climate change was focused on the adequacy of the Company’s disclosures in the financial
statements as set out in note 1a and conclusion that there was no further impact of climate change to be taken into account as
the investments are valued based on market pricing as required by FRS102. We also challenged the Directors’ considerations of
climate change in their assessment of viability and associated disclosures.
Key audit matters
Key audit matters are those matters that, in our professional judgment, were of most significance in our audit of the financial
statements of the current period and include the most significant assessed risks of material misstatement (whether or not due
to fraud) that we identified. These matters included those which had the greatest effect on: the overall audit strategy, the
allocation of resources in the audit; and directing the efforts of the engagement team. These matters were addressed in the
context of our audit of the financial statements as a whole, and in our opinion thereon, and we do not provide a separate
opinion on these matters.
Key observations communicated to the
Risk Our response to the risk Audit Committee
The results of our procedures identified
no material misstatements in relation to
the risk of incomplete or inaccurate
revenue recognition, including
classification of special dividends as
revenue or capital items in the Statement
of Comprehensive Income.
We performed the following procedures:
We ob
tained an understanding of the
Administrator’s process and controls
surrounding revenue recognition by
performing walkthrough procedures.
For all dividends received and accrued,
we recalculated the dividend income by
multiplying the investment holdings at the
ex-dividend date, traced from the
accounting records, by the dividend per
share, which was agreed to an
independent data vendor. We also agreed
all exchange rates to an external source
and, for a sample of dividends received
and dividends accrued, we agreed the
amounts to bank statements.
Incomplete or inaccurate revenue
r
ecognition, including the classification of
special dividends as revenue or capital
items in the Statement of Comprehensive
Income
Refer to the Audit Committee Report
(page55); Accounting policies (page 73).
The total revenue for the year to
31stMarch 2024 was £24.05 million
(2023:£22.50 million), consisting primarily
of dividend income from listed equity
investments.
European Discovery AR 04 Independent Auditors Report p61-67.qxp 20/06/2024 09:50 Page 63

Independent Auditor’s Report
64 JPMorgan European Discovery Trust plc – Annual Report & Financial Statements 2024
Independent Auditor’s Report
Key observations communicated to the
Risk Our response to the risk Audit Committee
To test completeness of recorded income,
we tested that expected dividends for
each investee company held during the
year had been recorded as income with
reference to an external source.
For all dividends accrued at the year end,
we reviewed the investee company
announcements to assess whether the
entitlement arose prior to 31st March 2024.
For all investments held during the year,
we inspected the type of dividends paid
with reference to an external data source
to identify those which were special
dividends. We confirmed four special
dividends, amounting to £1.08 million,
were received during the year. We tested
one special dividend (amounting to
£0.78million), which was above our
testing threshold, by recalculating the
amount received and assessing the
appropriateness of classification as
revenue by reviewing the underlying
circumstances of the special dividend
received.
The Company received special dividends
amounting t
o £1.08 million (2023:
£3.48million). All were classified as
revenue.
There is a risk of incomplete or inaccurate
recognition of revenue through the failure
to recognise proper income entitlements
or to apply an appropriate accounting
treatment.
In addition, the Directors may apply
judgment in determining whether income
receivable in the form of special dividends
should be classified as ‘revenue’ or
‘capital’ in the Statement of
Comprehensive Income.
The results of our procedures identified
no ma
terial misstatements in relation to
the risk of incorrect valuation or
ownership of the investment portfolio.
We performed the following procedures:
We ob
tained an understanding of the
Administrator’s processes and controls
surrounding investment valuation and
legal title by performing walkthrough
procedures.
For all listed investments, we compared
the market prices and exchange rates
applied to an independent pricing vendor
and recalculated the investment
valuations as at the year end.
We inspected the stale pricing reports
produced by the Administrator to identify
prices that have not changed within one
business day and verified whether the
listed price is a valid fair value. We did not
identify any investments with stale
pricing.
We compared the Company’s investment
holdings at 31st March 2024 to
independent confirmations received
directly from the Company’s Custodian
and Depositary.
Incorrect valuation or ownership of the
inv
estment portfolio
Refer to the Audit Committee Report
(page55) and Accounting policies
(page73).
The valuation of the investment portfolio at
31st March 2024 was £829.74 million
(2023:£839.58 million) consisting primarily
of listed equities.
The valuation of investments held in the
investment portfolio is the key driver of the
Company’s net asset value and total
return. Incorrect investment pricing, or
failure to maintain proper legal title of the
investments held by the Company, could
have a significant impact on the portfolio
valuation and the return generated for
shareholders.
European Discovery AR 04 Independent Auditors Report p61-67.qxp 20/06/2024 09:50 Page 64

Independent Auditor’s Report
J.P. Morgan Asset Management 65
Independent Auditor’s Report
Our application of materiality
The results of our procedures identified no material
misstatements in relation to the risk of incorrect valuation or
ownership of the investment portfolio.
Materiality
The magnitude of an omission or misstatement that,
individually or in the aggregate, could reasonably be expected
to influence the economic decisions of the users of the
financial statements. Materiality provides a basis for
determining the nature and extent of our audit procedures.
We determined materiality for the company to be £7.69 million
(2023: £7.85 million), which is 1% (2023: 1%) of shareholders’
funds. We believe that shareholders’ funds provides us with
materiality aligned to the key measure of the Company’s
performance.
Performance materiality
The application of materiality at the individual account or
balance level. It is set at an amount to reduce to an
appropriately low level the probability that the aggregate of
uncorrected and undetected misstatements exceeds
materiality.
On the basis of our risk assessments, together with our
assessment of the company’s overall control environment,
our judgement was that performance materiality was 75%
(2023: 75%) of our planning materiality, namely £5.77 million
(2023: £5.89 million). We have set performance materiality at
this percentage due to our past experience of the audit that
indicates a lower risk of misstatements, both corrected and
uncorrected.
Given the importance of the distinction between revenue and
capital for investment trusts, we also applied a separate
testing threshold for the revenue column of the Statement of
Comprehensive Income of £1.01 million (2023: £0.97 million),
being 5% of the net revenue return before taxation.
Reporting threshold
An amount below which identified misstatements are
considered as being clearly trivial.
We agreed with the audit committee that we would report to
them all uncorrected audit differences in excess of
£0.38million (2023: £0.39 million), which is set at 5% of
planning materiality, as well as differences below that
threshold that, in our view, warranted reporting on qualitative
grounds.
We evaluate any uncorrected misstatements against both the
quantitative measures of materiality discussed above and in
light of other relevant qualitative considerations in forming
our opinion.
Other information
The other information comprises the information included in
the annual report, other than the financial statements and
our auditor’s report thereon. The Directors are responsible for
the other information contained within the annual report.
Our opinion on the financial statements does not cover the
other information and, except to the extent otherwise explicitly
stated in this report, we do not express any form of assurance
conclusion thereon.
Our responsibility is to read the other information and, in
doing so, consider whether the other information is materially
inconsistent with the financial statements or our knowledge
obtained in the course of the audit or otherwise appears to be
materially misstated. If we identify such material
inconsistencies or apparent material misstatements, we are
required to determine whether this gives rise to a material
misstatement in the financial statements themselves. If,
based on the work we have performed, we conclude that
there is a material misstatement of the other information, we
are required to report that fact.
We have nothing to report in this regard.
Opinions on other matters prescribed by the
Companies Act 2006
In our opinion the part of the Directors’ remuneration report to
be audited has been properly prepared in accordance with
the Companies Act 2006.
In our opinion, based on the work undertaken in the course of
the audit:
• the information given in the strategic report and the
Directors’ report for the financial year for which the
financial statements are prepared is consistent with the
financial statements; and
• the strategic report and Directors’ reports have been
prepared in accordance with applicable legal
requirements;
Matters on which we are required to report by
exception
In the light of the knowledge and understanding of the
company and its environment obtained in the course of the
audit, we have not identified material misstatements in the
strategic report or Directors’ report.
We have nothing to report in respect of the following matters
in relation to which the Companies Act 2006 requires us to
report to you if, in our opinion:
• adequate accounting records have not been kept, or
returns adequate for our audit have not been received
from branches not visited by us; or
European Discovery AR 04 Independent Auditors Report p61-67.qxp 20/06/2024 09:50 Page 65

Independent Auditor’s Report
66 JPMorgan European Discovery Trust plc – Annual Report & Financial Statements 2024
Independent Auditor’s Report
• the financial statements and the part of the Directors’
Remuneration Report to be audited are not in agreement
with the accounting records and returns; or
• certain disclosures of Directors’ remuneration specified by
law are not made; or
• we have not received all the information and explanations
we require for our audit.
Corporate Governance Statement
We have reviewed the Directors’ statement in relation to going
concern, longer-term viability and that part of the Corporate
Governance Statement relating to the Company’s compliance
with the provisions of the UK Corporate Governance Code
specified for our review by the Listing Rules.
Based on the work undertaken as part of our audit, we have
concluded that each of the following elements of the
Corporate Governance Statement is materially consistent with
the financial statements or our knowledge obtained during
the audit:
• Directors’ statement with regards to the appropriateness
of adopting the going concern basis of accounting and
any material uncertainties identified set out on page 56;
• Directors’ explanation as to its assessment of the
Company’s prospects, the period this assessment covers
and why the period is appropriate set out on page 39;
• Director’s statement on whether it has a reasonable
expectation that the Company will be able to continue in
operation and meets its liabilities set out on page 56;
• Directors’ statement on fair, balanced and understandable
set out on page 56;
• Board’s confirmation that it has carried out a robust
assessment of the emerging and principal risks set out on
page 36;
• The section of the annual report that describes the review
of effectiveness of risk management and internal control
systems set out on page 52; and;
• The section describing the work of the audit committee set
out on page 55.
Responsibilities of directors
As explained more fully in the Directors’ responsibilities
statement set out on page 60, the Directors are responsible
for the preparation of the financial statements and for being
satisfied that they give a true and fair view, and for such
internal control as the Directors determine is necessary to
enable the preparation of financial statements that are free
from material misstatement, whether due to fraud or error.
In preparing the financial statements, the Directors are
responsible for assessing the Company’s ability to continue
as a going concern, disclosing, as applicable, matters related
to going concern and using the going concern basis of
accounting unless the Directors either intend to liquidate the
company or to cease operations, or have no realistic
alternative but to do so.
Auditor’s responsibilities for the audit of the
financial statements
Our objectives are to obtain reasonable assurance about
whether the financial statements as a whole are free from
material misstatement, whether due to fraud or error, and to
issue an auditor’s report that includes our opinion.
Reasonable assurance is a high level of assurance, but is not
a guarantee that an audit conducted in accordance with ISAs
(UK) will always detect a material misstatement when it exists.
Misstatements can arise from fraud or error and are
considered material if, individually or in the aggregate, they
could reasonably be expected to influence the economic
decisions of users taken on the basis of these financial
statements.
Explanation as to what extent the audit was
considered capable of detecting irregularities,
including fraud
Irregularities, including fraud, are instances of
non-compliance with laws and regulations. We design
procedures in line with our responsibilities, outlined above, to
detect irregularities, including fraud. The risk of not detecting
a material misstatement due to fraud is higher than the risk of
not detecting one resulting from error, as fraud may involve
deliberate concealment by, for example, forgery or intentional
misrepresentations, or through collusion. The extent to which
our procedures are capable of detecting irregularities,
including fraud is detailed below.
However, the primary responsibility for the prevention and
detection of fraud rests with both those charged with
governance of the Company and management.
• We obtained an understanding of the legal and regulatory
frameworks that are applicable to the Company and
determined that the most significant are FRS 102, the
Companies Act 2006, the Listing Rules, the UK Corporate
Governance Code, the Association of Investment
Companies’ Code and Statement of Recommended
Practice and Section 1158 of the Corporation Tax Act 2010.
• We understood how the Company is complying with those
frameworks through discussions with the audit committee
and company secretary, and review of Board minutes and
papers provided to the audit committee.
• We assessed the susceptibility of the Company’s financial
statements to material misstatement, including how fraud
might occur by considering the key risks impacting the
financial statements. We identified a fraud risk with
European Discovery AR 04 Independent Auditors Report p61-67.qxp 20/06/2024 09:50 Page 66

Independent Auditor’s Report
J.P. Morgan Asset Management 67
Independent Auditor’s Report
respect to incomplete or inaccurate revenue recognition
through incorrect classification of special dividends as
revenue or capital items in the statement of
comprehensive income. Further discussion of our
approach is set out in the key audit matter above.
• Based on this understanding we designed our audit
procedures to identify non-compliance with such laws and
regulations. Our procedures involved review of the
company secretary’s reporting to the Directors with
respect to the application of the documented policies and
procedures, and review of the financial statements to
ensure compliance with the reporting requirements of the
Company.
A further description of our responsibilities for the audit of the
financial statements is located on the Financial Reporting
Council’s website at
https://www.frc.org.uk/auditorsresponsibilities
. This
description forms part of our auditor’s report.
Other matters we are required to address
• Following the recommendation from the audit committee,
we were appointed by the Company at its annual general
meeting on 10th July 2019 to audit the financial statements
for the year ending 31st March 2020 and subsequent
financial periods.
The period of total uninterrupted engagement including
previous renewals and reappointments is five years,
covering the period from our appointment through to the
period ending 31st March 2024.
• The audit opinion is consistent with the additional report to
the audit committee.
Use of our report
This report is made solely to the Company’s members, as
abody, in accordance with Chapter 3 of Part 16 of the
Companies Act 2006. Our audit work has been undertaken so
that we might state to the Company’s members those matters
we are required to state to them in an auditor’s report and for
no other purpose. To the fullest extent permitted by law, we do
not accept or assume responsibility to anyone other than the
Company and the Company’s members as a body, for our
audit work, for this report, or for the opinions we have formed.
Caroline Mercer (Senior statutory auditor)
for and on behalf of
Ernst & Young LLP, Statutory Auditor
Edinburgh
19th June 2024
European Discovery AR 04 Independent Auditors Report p61-67.qxp 20/06/2024 09:50 Page 67

Image:
Financial Statements
European Discovery AR 05 Financial Statements p68-90.qxp 20/06/2024 09:52 Page 68

J.P. Morgan Asset Management 69
Statement of Comprehensive Income
Financial Statements
For the year ended 31st March
2024 2023
Revenue Capital Total Revenue Capital Total
Notes £’000 £’000 £’000 £’000 £’000 £’000
Gains/(losses) on investments and derivatives
held at fair value through profit or loss 3 — 25,759 25,759 — (45,535) (45,535)
Foreign exchange (losses)/gains on liquidity fund — (172) (172) — 2,265 2,265
Net foreign currency gains/(losses) — 2,225 2,225 — (2,366) (2,366)
Income from investments 4 23,050 — 23,050 22,389 — 22,389
Interest receivable and similar income 4 932 — 932 113 — 113
Gross return/(loss) 23,982 27,812 51,794 22,502 (45,636) (23,134)
Management fee 5 (1,732) (4,041) (5,773) (1,925) (4,491) (6,416)
Other administrative expenses 6 (860) — (860) (690) — (690)
Net return/(loss) before finance costs and taxation 21,390 23,771 45,161 19,887 (50,127) (30,240)
Finance costs 7 (1,227) (2,861) (4,088) (530) (1,237) (1,767)
Net return/(loss) before taxation 20,163 20,910 41,073 19,357 (51,364) (32,007)
Taxation 8 (1,493) — (1,493) (1,845) — (1,845)
Net return/(loss) after taxation 18,670 20,910 39,580 17,512 (51,364) (33,852)
Return/(loss) per share 9 12.04p 13.49p 25.53p 11.11p (32.60)p (21.49)p
A final dividend of 8.0p per share (2023: 7.8p per share) is proposed in respect of the year ended 31st March 2024, costing
£11,815,000 (2023: £12,283,000). More details can be found in note 10(a) on page 78.
All revenue and capital items in the above statement derive from continuing operations. No operations were acquired or
discontinued in the year.
The ‘Total’ column of this statement is the profit and loss account of the Company and the revenue and capital columns
represent supplementary information prepared under guidance issued by the Association of Investment Companies.
The net return/(loss) on ordinary activities after taxation represents the profit for the year and also Total Comprehensive Income.
The notes on pages 73 to 90 form an integral part of these financial statements.
European Discovery AR 05 Financial Statements p68-90.qxp 20/06/2024 09:52 Page 69

Called up Capital
share Share redemption Capital Revenue
capital premium reserve reserves
1
reserve
1
Total
£’000 £’000 £’000 £’000 £’000 £’000
At 31st March 2022 7,924 1,312 7,712 805,617 11,154 833,719
Repurchase and cancellation of the Company’s
own shares (50) — 50 (4,254) — (4,254)
Net return on ordinary activities — — — (51,364) 17,512 (33,852)
Dividends paid in the year (note 10) — — — — (10,551) (10,551)
At 31st March 2023 7,874 1,312 7,762 749,999 18,115 785,062
Repurchase of shares into Treasury — — — (40,278) — (40,278)
Proceeds from unclaimed shares forfeited
2
— — — 658 — 658
Net return on ordinary activities — — — 20,910 18,670 39,580
Dividends paid in the year (note 10) — — — — (15,976) (15,976)
At 31st March 2024 7,874 1,312 7,762 731,289 20,809 769,046
1
These reserves form the distributable reserves of the Company and may be used to fund distribution of profits to investors via dividend payments.
2
During the year the Company undertook an Asset Reunification Program for its shareholders. As a result, shares that could not be traced to shareholders for more
than 12 years, were forfeited. In accordance with the Company’s Articles of Association, these share were sold in the open market and the proceeds returned to
the Company.
The notes on pages 73 to 90 form an integral part of these financial statements.
70 JPMorgan European Discovery Trust plc – Annual Report & Financial Statements 2024
Statement of Changes in Equity
Financial Statements
European Discovery AR 05 Financial Statements p68-90.qxp 20/06/2024 09:52 Page 70

At 31st March
2024 2023
Notes £’000 £’000
Fixed assets
Investments held at fair value through profit or loss 11 829,738 839,582
Current assets 12
Debtors 6,815 16,100
Cash and cash equivalents 7,554 47,000
14,369 63,100
Current liabilities 13
Creditors: amounts falling due within one year (2,391) (117,620)
Net current assets/(liabilities) 11,978 (54,520)
Total assets less current liabilities 841,716 785,062
Current liabilities
Creditors: amounts falling due after more than one year 14 (72,670) —
Net assets 769,046 785,062
Capital and reserves
Called up share capital 15 7,874 7,874
Share premium 16 1,312 1,312
Capital redemption reserve 16 7,762 7,762
Capital reserves 16 731,289 749,999
Revenue reserve 16 20,809 18,115
Total shareholders’ funds 769,046 785,062
Net asset value per share 17 520.7p 498.5p
Included in the investments held at fair valuation through profit or loss are investments of £52,989,000 (2023: £41,510,000) that
are on loan under securities lending arrangements.
The financial statements on pages 69 to 72 were approved and authorised for issue by the Directors on 19th June 2024 and were
signed on their behalf by:
Marc van Gelder
Director
The notes on pages73 to 90 form an integral part of these financial statements.
JPMorgan European Discovery Trust plc
Company registration number: 2431143
J.P. Morgan Asset Management 71
Statement of Financial Position
Financial Statements
European Discovery AR 05 Financial Statements p68-90.qxp 20/06/2024 09:52 Page 71

For the year ended 31st March
2024 2023
£’000 £’000
Cash flows from operating activities
Net return/(loss) before finance costs and taxation 45,161 (30,240)
Adjustment for:
Net (gains)/losses on investments held at fair value through profit or loss (25,759) 45,535
Foreign exchange losses/(gains) on liquidity fund 172 (2,265)
Net foreign currency (gains)/losses (2,225) 2,366
Dividend income (23,050) (22,201)
Interest income (801) —
Scrip dividends received as income — (188)
Realised loss on foreign exchange transactions (486) (567)
Realised foreign exchange (losses)/gains on JPMorgan Euro Liquidity Fund (267) 2,897
Increase in accrued income and other debtors (37) (40)
(Decrease)/increase in accrued expenses (31) 17
Net cash outflow from operating activities before dividends and interest (7,323) (4,686)
Dividends received 23,751 21,467
Interest received 748 1
Overseas withholding tax recovered/(paid) (2,881) (2,841)
Net cash inflow from operating activities 14,295 13,941
Purchases of investments and derivatives (683,947) (733,345)
Sales of investments and derivatives 723,852 675,882
Settlement of forward foreign currency contracts — 2
Net cash inflow/(outflow) from investing activities 39,905 (57,461)
Dividends paid (note 10) (15,976) (10,551)
Repurchase and cancellation of the Company’s own shares — (4,412)
Repurchase of shares into Treasury (39,592) —
Proceeds from unclaimed shares forfeited 658 —
Repayment of Bank loan — (42,528)
Drawdown of Bank loan (34,447) 74,509
Interest paid (4,770) (1,184)
Net cash (outflow)/inflow from financing activities (94,127) 15,834
Decrease in cash and cash equivalents (39,927) (27,686)
Cash and cash equivalents at start of year 47,000 75,318
Exchange movements 87 (632)
Cash and cash equivalents at end of year 7,160 47,000
Cash and cash equivalents consist of:
Cash and short term deposits 312 447
Cash held in JPMorgan Euro Liquidity Fund 7,242 46,553
Cash and cash equivalents per the Statement of Financial Position 7,554 47,000
Bank overdraft (included as part of current liabilities in note 13) (394) —
Total cash, cash equivalents and bank overdraft per the Statement of Cash Flows 7,160 47,000
72 JPMorgan European Discovery Trust plc – Annual Report & Financial Statements 2024
Statement of Cash Flows
Financial Statements
European Discovery AR 05 Financial Statements p68-90.qxp 20/06/2024 09:52 Page 72

J.P. Morgan Asset Management 73
Notes to the Financial Statements
Financial Statements
For the year ended 31st March 2024
1. Accounting policies
(a) Basis of accounting
The financial statements are prepared under the historical cost convention, modified to include fixed asset investments at
fair value, and in accordance with the Companies Act 2006, United Kingdom Generally Accepted Accounting Practice (‘UK
GAAP’), including ‘the Financial Reporting Standard applicable in the UK and Republic of Ireland’ (‘FRS 102’) and with the
Statement of Recommended Practice ‘Financial Statements of Investment Trust Companies and Venture Capital Trusts’ (the
‘SORP’) issued by the Association of Investment Companies in July 2022. In preparing these financial statements the
Directors have considered the impact of climate change risk as a principal risk as set out on page 38, and have concluded
that it does not have a material impact on the Company’s investments. In line with FRS 102 investments are valued at fair
value, which for the Company are quoted bid prices for investments in active markets at the 31st March 2024 and therefore
reflect market participants view of climate change risk.
All of the Company’s operations are of a continuing nature.
The financial statements have been prepared on a going concern basis. The Board has, in particular, considered the
exacerbation of geopolitical events in Ukraine and the Middle East, arising from geopolitical risks, including the crisis in
Ukraine and Russia and the Middle East, and does not believe the Company’s going concern status is affected. They have
considered the potential impact and the mitigation measures which key service providers including Managers, have in place
to maintain operational resilience and believe the adverse impact of further pandemics has declined. The Directors have
reviewed income and expense projections to 30th June 2025 and the liquidity of the investment portfolio in making their
assessment. Further details of Directors’ considerations regarding this are given in the Chairman’s Statement, Investment
Managers’ report, Going Concern Statement , Viability Statement and Principal Risks section of this Annual Report.
The policies applied in these financial statements are consistent with those applied in the preceding year.
(b) Valuation of investments
The Company has chosen to adopt Sections 11 and 12 of FRS 102 in respect of financial instruments.
The Company’s business is investing in financial assets with a view to profiting from their total return in the form of income
and capital growth. The portfolio of financial assets is managed and its performance evaluated on a fair value basis, in
accordance with a documented investment strategy and information is provided internally on that basis to the Company’s
Board of Directors.
Accordingly, upon initial recognition the investments are classified by the Company as held at fair value through profit or
loss. They are included initially at transaction price which is taken to be their cost, excluding expenses incidental to purchase
which are recognised in the capital column of the Statement of Comprehensive Income, at the time of acquisition.
Subsequently the investments are valued at fair value, which are quoted bid prices for investments traded in active markets.
For investments which are not traded in active markets, unlisted and restricted investments, the Board takes into account
the latest traded prices, other observable market data and asset values based on the latest management accounts.
Investments that are subject to securities lending arrangements are recognised in the Statement of Financial Position.
All purchases and sales are accounted for on a trade date basis.
(c) Accounting for reserves
Gains and losses on sales of investments including the related foreign exchange gains and losses, realised gains and losses
on foreign currency cash balances and loans, realised gains and losses on foreign currency contracts, management fee and
finance costs allocated to capital and any other capital charges, are included in the Statement of Comprehensive Income
and dealt with in capital reserves within ‘Realised gains and losses’.
Increases and decreases in the valuation of investments held at the year end including the related foreign exchange gains
and losses, plus unrealised gains and losses on foreign currency contracts or foreign currency loans are included in the
Statement of Comprehensive Income and dealt with in capital reserves within ‘Investment holding gains and losses’.
(d) Income
Dividends receivable from equity shares are included in revenue on an ex-dividend basis except where, in the opinion of the
Board, the dividend is capital in nature, in which case it is included in capital.
Overseas dividends are included gross of any withholding tax.
European Discovery AR 05 Financial Statements p68-90.qxp 20/06/2024 09:52 Page 73

1. Accounting policies (continued)
(d) Income (continued)
Special dividends are looked at individually to ascertain the reason behind the payment. This will determine whether they are
treated as revenue or capital. The Directors may exercise judgement in assessing the classification of special dividends as
revenue or capital income.
Where the Company has elected to receive scrip dividends in the form of additional shares rather than in cash, the amount of
the cash dividend foregone is recognised in revenue. Any excess in the value of the shares received over the amount of the
cash dividend is recognised in capital.
Deposit interest receivable is taken to revenue on an accruals basis.
Securities lending income is taken to revenue on a receipts basis which is not considered to be materially different to the
accruals basis.
(e) Expenses
All expenses are accounted for on an accruals basis. Expenses are allocated wholly to the revenue column of the Statement
of Comprehensive Income with the following exceptions:
– The management fee is allocated 30% to revenue and 70% to capital, in line with the Board’s expected long term split of
revenue and capital return from the Company’s investment portfolio.
– Expenses incidental to the purchase of an investment are charged to capital. These expenses are commonly referred to
as transaction costs and mainly comprise brokerage commission.
(f) Finance costs
Finance costs are accounted for on an accruals basis using the effective interest rate method.
Finance costs are allocated 30% to revenue and 70% to capital, in line with the Board’s expected long term split of revenue
and capital return from the Company’s investment portfolio.
(g) Financial instruments
Financial instruments are recognised only when the Company becomes a party to contractual provisions of the instruments.
Financial assets are derecognised when the contractual rights to the cash flows from the financial asset expire or are settled.
Financial liabilities are derecognised when the obligation specified in the contract is discharged, is cancelled or expires.
Cash and cash equivalents may comprise cash including demand deposits which are readily convertible to a known amount
of cash and are subject to an insignificant risk of change in value. JPMorgan Euro Liquidity funds are considered cash
equivalents as they are held for cash management purposes as an alternative to cash. The JPMorgan Euro Liquidity fund
portfolio consists of short dated deposits and commercial paper, a maturity profile of less than three months and low
volatility net asset value.
Other debtors and creditors do not carry any interest, are short term in nature and are accordingly stated at nominal value,
with debtors reduced by appropriate allowances for estimated irrecoverable amounts.
Bank loans and overdrafts are recorded initially at the proceeds received net of direct issue costs. Loans are subsequently
recorded at amortised cost using the effective interest method. Interest payable on the bank loan and overdraft is accounted
for on an accruals basis in the Statement of Comprehensive Income.
(h) Taxation
Current tax is provided at the amounts expected to be paid or recovered.
Deferred tax is provided on all timing differences that have originated but not reversed by the balance sheet date. Deferred
tax liabilities are recognised for all taxable timing differences but deferred tax assets are only recognised to the extent that it
is more likely than not that taxable profits will be available against which those timing differences can be utilised.
Tax relief is allocated to expenses charged to capital on the ‘marginal basis’. On this basis, if taxable income is capable of
being entirely offset by revenue expenses, then no tax relief is transferred to the capital column.
74 JPMorgan European Discovery Trust plc – Annual Report & Financial Statements 2024
Notes to the Financial Statements
Financial Statements
European Discovery AR 05 Financial Statements p68-90.qxp 20/06/2024 09:52 Page 74

J.P. Morgan Asset Management 75
Notes to the Financial Statements
Financial Statements
Deferred tax is measured at the tax rate which is expected to apply in the periods in which the timing differences are
expected to reverse, based on tax rates that have been enacted or substantively enacted at the balance sheet date and is
measured on an undiscounted basis.
(i) Value Added Tax (‘VAT’)
Expenses are disclosed inclusive of the related irrecoverable VAT. Recoverable VAT is calculated using the partial exemption
method based on the proportion of zero rated supplies to total supplies.
(j) Foreign currency
The Company is required to identify its functional currency, being the currency of the primary economic environment in
which the Company operates.
The Board, having regard to the currency of the Company’s share capital and the predominant currency in which its
shareholders operate, has determined that sterling is the functional currency. Sterling is also the currency in which the
financial statements are presented.
Transactions denominated in foreign currencies are converted at actual exchange rates at the date of the transaction.
Monetary assets, liabilities and equity investments held at fair value, denominated in foreign currencies at the year end are
translated at the rates of exchange prevailing at the year end.
Any gain or loss arising from a change in exchange rates subsequent to the date of the transaction is included in the
Statement of Comprehensive Income as an exchange gain or loss in revenue or capital, depending on whether the gain or
loss is of a revenue or capital nature.
(k) Dividends paid
Final dividends are included in the financial statements once approved by shareholders and interim dividends are included
in the financial statements in the year in which they are paid.
(l) Repurchase of ordinary shares for cancellation
The cost of repurchasing ordinary shares including the related stamp duty and transactions costs is charged to ‘Capital
reserves’ and dealt with in the Statement of Changes in Equity. Share repurchase transactions are accounted for on a trade
date basis. The nominal value of ordinary share capital repurchased and cancelled is transferred out of ‘Called up share
capital’ and into ‘Capital redemption reserve’.
(m) Segmental Reporting
Operating segments are reported in a manner consistent with the internal reporting provided to the chief operating
decision-maker. The chief operating decision-maker, who is responsible for allocating resources and assessing
performance of the operating segments, has been identified as the Board. The Directors are of the opinion that the
Companyis engaged in a single segment of investment business. The Directors manage the business in this way.
2. Significant accounting judgements, estimates and assumptions
The preparation of the Company’s financial statements on occasion requires management to make judgements, estimates and
assumptions that affect the reported amounts in the primary financial statements and the accompanying disclosures. These
assumptions and estimates could result in outcomes that require a material adjustment to the carrying amount of assets or
liabilities affected in the current and future periods, depending on circumstance.
The Directors do not believe that any accounting judgements or estimates have been applied to this set of financial statements
that have a significant risk of causing a material adjustment to the carrying amount of assets and liabilities within the next
financial year.
European Discovery AR 05 Financial Statements p68-90.qxp 20/06/2024 09:52 Page 75

3. Gains/(losses) on investments held at fair value through profit or loss
2024 2023
£’000 £’000
Realised gains/(losses) on sale of investments 14,211 (45,047)
Net change in unrealised gains and losses on investments 11,597 (429)
Other capital charges (49) (59)
Total capital gains/(losses) on investments held at fair value through profit or loss 25,759 (45,535)
4. Income
2024 2023
£’000 £’000
Income from investments
Overseas dividends 21,967 18,725
Scrip dividends — 188
Special dividends 1,083 3,476
23,050 22,389
Interest receivable and similar income
Securities lending income 131 113
Deposit interest
118 —
Income from JPMorgan Euro Liquidity Fund 683 —
932 113
Total income 23,982 22,502
5. Management fee
2024 2023
Revenue Capital Total Revenue Capital Total
£’000 £’000 £’000 £’000 £’000 £’000
Management fee 1,732 4,041 5,773 1,925 4,491 6,416
Details of the management fee are given in the Directors’ Report on page 46.
6. Other administrative expenses
2024 2023
£’000 £’000
Administration expenses 538 379
Directors’ fees
1
178 172
Depositary fee 91 89
Auditors’ remuneration for audit services 53 50
860 690
1
Full disclosure is given in the Directors’ Remuneration Report on pages 56 to 59.
76 JPMorgan European Discovery Trust plc – Annual Report & Financial Statements 2024
Notes to the Financial Statements
Financial Statements
European Discovery AR 05 Financial Statements p68-90.qxp 20/06/2024 09:52 Page 76

J.P. Morgan Asset Management 77
Notes to the Financial Statements
Financial Statements
7. Finance Costs
2024 2023
Revenue Capital Total Revenue Capital Total
£’000 £’000 £’000 £’000 £’000 £’000
Interest on bank loans and overdrafts 1,227 2,861 4,088 530 1,237 1,767
1,227 2,861 4,088 530 1,237 1,767
8. Taxation
(a) Analysis of tax charge for the year
2024 2023
£’000 £’000
Overseas withholding tax 1,493 1,845
1
Total tax charge for the year 1,493 1,845
1
Contains historic withholding tax reclaimed under EU law based principles and recognised as windfall on receipt.
(b) Factors affecting total tax charge for the year
The tax charge for the year is lower (2023: lower) than the Company’s applicable rate of corporation tax for the year of 25%
(2023: 19%). The factors affecting the total tax charge for the year are as follows:
2024 2023
Revenue Capital Total Revenue Capital Total
£’000 £’000 £’000 £’000 £’000 £’000
Net return/(loss) before taxation 20,163 20,910 41,073 19,357 (51,364) (32,007)
Net return/(loss) before taxation multiplied
by the Company’s applicable rate
of corporation tax of 25% (2023: 19%) 5,041 5,227 10,268 3,678 (9,759) (6,081)
Effects of:
Non taxable capital (gains)/losses — (6,953) (6,953) — 8,671 8,671
Non taxable overseas dividends (5,737) — (5,737) (4,218) — (4,218)
Non taxable scrip dividends — — — (36) — (36)
Overseas withholding tax 1,493 — 1,493 1,845 — 1,845
Tax attributable to expenses and finance
costs charged to capital (1,500) 1,500 — (1,088) 1,088 —
Unutilised expenses carried forward to
future periods 2,100 — 2,100 1,664 — 1,664
Disallowed interest 96 226 322 — — —
Total tax charge for the year 1,493 — 1,493 1,845 — 1,845
(c) Deferred taxation
The Company has an unrecognised deferred tax asset of £31,679,000 (2023: £29,578,000) based on a prospective corporation
tax rate of 25% (2023: 25%). The deferred tax asset has arisen due to £126,715,000 (2023: £118,312,000) the cumulative excess
of deductible expenses over taxable income.
Given the composition of the Company’s portfolio, it is not likely that this asset will be utilised in the foreseeable future and
therefore no asset has been recognised in the financial statements.
Given the Company’s status as an investment trust company and the intention to continue meeting the conditions required
to obtain approval, the Company has not provided for deferred tax on any capital gains or losses arising on the revaluation or
disposal of investments.
European Discovery AR 05 Financial Statements p68-90.qxp 20/06/2024 09:52 Page 77

9. Return/(loss) per share
2024 2023
£’000 £’000
Revenue return 18,670 17,512
Capital return/(loss) 20,910 (51,364)
Total return/(loss) 39,580 (33,852)
Weighted average number of shares in issue during the year 155,063,487 157,569,054
Revenue return per share 12.04p 11.11p
Capital return/(loss) per share 13.49p (32.60)p
Total return/(loss) per share 25.53p (21.49)p
10. Dividends
(a) Dividends paid and declared
2024 2023
Pence £’000 Pence £’000
Dividends paid
Unclaimed dividends returned to the Company — (120) — —
Final dividend in respect of the prior year 7.8 12,283 5.5 8,661
Interim dividend 2.5 3,813 1.2 1,890
Total dividends paid in the year 10.3 15,976 6.7 10,551
Dividend proposed
Final dividend 8.0 11,815 7.8 12,283
All dividends paid and declared in the period have been funded from the revenue reserve.
The final dividend has been proposed in respect of the year ended 31st March 2024 and is subject to approval at the
forthcoming Annual General Meeting. In accordance with the accounting policy of the Company, this dividend will be
reflected in the financial statements for the year ending 31st March 2025.
(b) Dividend for the purposes of Section 1158 of the Corporation Tax Act 2010 (‘Section 1158’)
The requirements of Section 1158 are considered on the basis of dividends declared in respect of the financial year, shown
below.
The revenue available for distribution by way of dividend for the year is £18,670,000 (2023: £17,512,000). The revenue reserve
after payment of the final dividend will amount to £8,994,000 (2023: £5,832,000).
2024 2023
Pence £’000 Pence £’000
Interim dividend 2.5 3,813 1.2 1,890
Final dividend 8.0 11,815 7.8 12,283
Total 10.5 15,628 9.0 14,173
78 JPMorgan European Discovery Trust plc – Annual Report & Financial Statements 2024
Notes to the Financial Statements
Financial Statements
European Discovery AR 05 Financial Statements p68-90.qxp 20/06/2024 09:52 Page 78

J.P. Morgan Asset Management 79
Notes to the Financial Statements
Financial Statements
11. Investments
2024 2023
£’000 £’000
Investments listed on a recognised stock exchange 829,738 839,582
Opening book cost 729,575 723,582
Opening investment holding gains 110,007 110,436
Opening valuation 839,582 834,018
Movements in the year:
Purchases at cost 678,199 739,023
Sales — proceeds (713,851) (687,983)
Losses on investments 25,808 (45,476)
829,738 839,582
Closing book cost 708,134 729,575
Closing investment holding gains 121,604 110,007
Total investments held at fair value through profit or loss 829,738 839,582
Transaction costs on purchases during the year amounted to £904,000 (2023: £1,100,000) and on sales during the year
amounted to £297,000 (2023: £368,000). These costs comprise mainly brokerage commission.
The Company received £713,851,000 (2023: £687,983,000) from investments sold in the year. The bookcost of these investments
when they were purchased was £699,640,000 (2023: £733,030,000). These investments have been revalued over time and until
they were sold any unrealised gains/losses were included in the fair value of the investments.
The Company participates in stock lending arrangements and further details can be found in note 21 (c), Credit risk, on page 88.
12. Current assets
2024 2023
£’000 £’000
Debtors
Securities sold awaiting settlement 2,067 12,129
Overseas tax recoverable 4,323 2,935
Dividends and interest receivable 292 940
VAT recoverable 78 40
Other debtors 55 56
6,815 16,100
The Directors consider that the carrying amount of debtors approximates to their fair value.
Cash and cash equivalents
Cash and cash equivalents comprise bank balances, short term deposits and liquidity funds. The carrying amount of these
represents their fair value.
European Discovery AR 05 Financial Statements p68-90.qxp 20/06/2024 09:52 Page 79

13. Creditors: amounts falling due within one year
2024 2023
£’000 £’000
Current liabilities
Creditors: amounts falling due within one year
Securities purchased awaiting settlement 1,075 6,823
Loan interest payable 71 753
Bank overdraft 394 —
Bank loan — 109,836
Repurchases of the Company’s own shares awaiting settlement 686 —
Other creditors and accruals 165 208
2,391 117,620
The Directors consider that the carrying amount of creditors falling due within one year approximates to their fair value.
The bank overdraft at the year end is as a result of timing on the settlement of trades at the year end. The overdraft is available to
the Company for short term settlement purposes only.
For details concerning the loan please refer to note 14.
14. Creditors: amounts falling due after more than one year
2024 2023
£’000 £’000
Bank loan 72,670 —
72,670 —
The Company has a Euro 140 million (2023: Euro 125 million) multicurrency revolving credit facility with The Bank of Nova Scotia.
This facility was renewed in January 2024 for two years and expires on 26th March 2026.
At the year end the Company had drawn down Euro 85 million of the credit facility (2023: Euro 125 million). Interest on the credit
facility is payable at a margin above the prevailing EURIBOR plus commitment fee for the period of the credit facility.
15. Called up share capital
2024 2023
Number of Number of
Shares £’000 Shares £’000
Authorised ordinary shares allotted and fully paid:
Opening balance of ordinary shares of 5p each 157,474,931 7,874 158,469,931 7,924
Repurchase and cancellation of shares — — (995,000) (50)
Repurchase of Ordinary shares into Treasury (9,782,472) (489) — —
Closing balance of Ordinary shares of 5p each
excluding shares held in Treasury 147,692,459 7,385 157,474,931 7,874
Shares held in Treasury 9,782,472 489 — —
Closing balance of ordinary shares of 5p each
including shares held in Treasury 157,474,931 7,874 157,474,931 7,874
Further details of transactions in the Company’s shares are given in the Strategic Report on page 33.
80 JPMorgan European Discovery Trust plc – Annual Report & Financial Statements 2024
Notes to the Financial Statements
Financial Statements
European Discovery AR 05 Financial Statements p68-90.qxp 20/06/2024 09:52 Page 80

J.P. Morgan Asset Management 81
Notes to the Financial Statements
Financial Statements
16. Capital and reserves
Capital reserves
1
Investment
Called up Capital Realised holding
share Share redemption gains and gains and Revenue
capital premium reserve losses losses reserve
1
Total
2024 £’000 £’000 £’000 £’000 £’000 £’000 £’000
Opening balance 7,874 1,312 7,762 639,631 110,368 18,115 785,062
Net foreign currency losses on cash and cash equivalents — — — (666) — — (666)
Realised gains on investments — — — 14,211 — — 14,211
Unrealised losses on investments — — — — 11,597 — 11,597
Repurchase of shares into Treasury — — — (40,278) — — (40,278)
Unrealised gains on loans and private placements — — — — 2,237 — 2,237
Proceeds from unclaimed shares forfeited — — — 658 — 120 778
Realised gains on repayment of loans — — — 482 — — 482
Management fee and finance costs allocated to capital — — — (6,902) — — (6,902)
Other capital charges — — — (49) — — (49)
Retained revenue for the year — — — — — 18,670 18,670
Dividends paid in the year — — — — — (16,096) (16,096)
Closing balance 7,874 1,312 7,762 607,087 124,202 20,809 769,046
1
These reserves form the distributable reserves of the Company and may be used to fund distribution of profits to investors.
Capital reserves
1
Investment
Called up Capital Realised holding
share Share redemption gains and gains and Revenue
capital premium reserve losses losses reserve
1
Total
2023 £’000 £’000 £’000 £’000 £’000 £’000 £’000
Opening balance 7,924 1,312 7,712 693,294 112,323 11,154 833,719
Net foreign currency gains on cash and cash equivalents — — — 1,698 — — 1,698
Unrealised gains/(losses) on foreign currency contracts — — — 2 (2) — —
Realised losses on investments — — — (45,047) — — (45,047)
Unrealised gains on investments — — — — (429) — (429)
Repurchase and cancellation of the Company’s own shares (50) — 50 (4,254) — — (4,254)
Unrealised losses on loans — — — — (1,524) — (1,524)
Realised losses on repayment of loans — — — (275) — — (275)
Management fee and finance costs allocated to capital — — — (5,728) — — (5,728)
Other capital charges — — — (59) — — (59)
Retained revenue for the year — — — — — 17,512 17,512
Dividends paid in the year — — — — — (10,551) (10,551)
Closing balance 7,874 1,312 7,762 639,631 110,368 18,115 785,062
1
These reserves form the distributable reserves of the Company and may be used to fund distribution of profits to investors.
17. Net asset value per share
2024 2023
Net assets (£’000) 769,046 785,062
Number of shares in issue 147,692,459 157,474,931
Net asset value per share 520.7p 498.5p
European Discovery AR 05 Financial Statements p68-90.qxp 20/06/2024 09:52 Page 81

18. Contingent liabilities and capital commitments
At the balance sheet date there were no contingent liabilities or capital commitments (2023: none).
19. Transactions with the Manager and related parties
Details of the management contract are set out in the Directors’ Report on page 46. The management fee payable to the
Manager for the year was £5,773,000 (2023: £6,416,000), of which £nil (2023: £nil) was outstanding at the year end.
Included in administration expenses in note 6 on page 76 are safe custody fees payable to JPMorgan Chase amounting to
£79,000 (2023: £86,000) excluding VAT of which £8,000 (2023: £30,000) was outstanding at the year end.
The Manager may carry out some of its dealing transactions through group subsidiaries. These transactions are carried out at
arm’s length. The commission payable to JPMorgan Securities Limited for the year was £44,000 (2023: £67,000) of which £nil
(2023: £nil) was outstanding at the year end.
The Company also holds cash in JPMorgan Euro Liquidity Fund, which is managed by JPMF. At the year end, this was valued at
£7.2 million (2023: £46.6 million). Interest amounting to £683,000 were payable (2023: £nil) during the year of which £53,000
(2023: £nil) was outstanding at the year end.
Securities lending income amounting to £131,000 (2023: £113,000) were receivable by the Company during the year. JPMAM
commissions in respect of such transactions amounted to £15,000 (2023: £13,000).
Handling charges on dealing transactions amounting to £49,000 (2023: £59,000) were payable to JPMorgan Chase during the
year of which £17,000 (2023: £29,000) was outstanding at the year end.
At the year end, the Company held cash of £311,000 and an overdraft of £394,000, resulting in net overdrawn amount of £83,000
(2022: cash held of £445,000 and £nil overdraft) with JPMorgan Chase Bank N.A. A net amount of interest of £118,000 (2023:
£2,000) was receivable by the Company during the year from JPMorgan Chase of which £nil (2023: £1,000) was outstanding at
the year end.
Full details of Directors’ remuneration and shareholdings can be found on page 58.
20. Disclosures regarding financial instruments measured at fair value
The Company’s financial instruments within the scope of FRS 102 that are held at fair value comprise its investment portfolio and
derivative financial instruments.
The investments are categorised into a hierarchy consisting of the following three levels:
Level 1: The unadjusted quoted price in an active market for identical assets or liabilities that the entity can access at the
measurement date
Level 2: Inputs other than quoted prices included within Level 1 that are observable (i.e.: developed using market data) for the
asset or liability, either directly or indirectly
Level 3: Inputs are unobservable (i.e.: for which market data is unavailable) for the asset or liability
Categorisation within the hierarchy has been determined on the basis of the lowest level input that is significant to the fair value
measurement of the relevant asset.
Details of the valuation techniques used by the Company are given in note 1(b) on page 73.
The following table sets out the fair value measurements using the FRS 102 hierarchy at 31st March.
2024 2023
Assets Liabilities Assets Liabilities
£’000 £’000 £’000 £’000
Level 1 829,738 — 839,582 —
Total 829,738 — 839,582 —
There have been no transfers between Levels 1, 2 or 3 during the year (2023: nil).
82 JPMorgan European Discovery Trust plc – Annual Report & Financial Statements 2024
Notes to the Financial Statements
Financial Statements
European Discovery AR 05 Financial Statements p68-90.qxp 20/06/2024 09:52 Page 82

J.P. Morgan Asset Management 83
Notes to the Financial Statements
Financial Statements
21. Financial instruments’ exposure to risk and risk management policies
As an investment trust, the Company invests in equities for the long term so as to secure its investment objective stated on the
‘Key Features’ page. In pursuing this objective, the Company is exposed to a variety of financial risks that could result in a
reduction in the Company’s net assets or a reduction in the profits available for dividends.
These financial risks include market risk (comprising currency risk, interest rate risk and other price risk), liquidity risk and
credit risk.
The Directors’ policy for managing these risks is set out below. The Company Secretary, in close cooperation with the Board and
the Manager, coordinates the Company’s risk management policy.
The objectives, policies and processes for managing the risks and the methods used to measure the risks that are set out below,
have not changed from those applying in the comparative year.
The Company’s classes of financial instruments are as follows:
– investments in European equity shares, which are held in accordance with the Company’s investment objective;
– cash held within a liquidity fund;
– short term debtors, creditors and cash arising directly from its operations; and
– loan facilities, the purpose of which are to finance the Company’s operations.
(a) Market risk
The fair value of future cash flows of a financial instrument held by the Company may fluctuate because of changes in
market prices. This market risk comprises three elements – currency risk, interest rate risk and other price risk. Information
to enable an evaluation of the nature and extent of these three elements of market risk is given in parts (i) to (iii) of this note,
together with sensitivity analyses where appropriate. The Board reviews and agrees policies for managing these risks and
these policies have remained unchanged from those applying in the comparative year. The Manager assesses the exposure
to market risk when making each investment decision and monitors the overall level of market risk on the whole of the
investment portfolio on an ongoing basis.
(i) Currency risk
Certain of the Company’s assets, liabilities and income are denominated in currencies other than sterling which is the
Company’s functional currency and the currency in which it reports. As a result, movements in exchange rates may affect
the sterling value of those items.
Management of currency risk
The Manager monitors the Company’s exposure to foreign currencies on a daily basis and reports to the Board, which
meets on at least five occasions each year. The Manager measures the risk to the Company of the foreign currency
exposure by considering the effect on the Company’s net asset value and income of a movement in the rates of exchange
to which the Company’s assets, liabilities, income and expenses are exposed. Foreign currency borrowing may be used to
limit the Company’s exposure to anticipated changes in exchange rates which might otherwise adversely affect the
sterling value of the portfolio of investments. This borrowing is limited to currencies and amounts commensurate with the
asset exposure to those currencies. Income denominated in foreign currencies is converted to sterling on receipt. The
Company may use short term forward currency contracts to manage working capital requirements.
European Discovery AR 05 Financial Statements p68-90.qxp 20/06/2024 09:52 Page 83

21. Financial instruments’ exposure to risk and risk management policies (continued)
(a) Market risk (continued)
(i) Currency risk (continued)
Foreign currency exposure
The fair values of the Company’s monetary items that have foreign currency exposure at 31st March are shown below.
Where the Company’s equity investments (which are not monetary items) are priced in a foreign currency, they have been
included separately in the analysis so as to show the overall level of exposure.
2024
Swiss Danish Swedish Norwegian
Euro francs krone krona krone Total
£’000 £’000 £’000 £’000 £’000 £’000
Current assets 11,723 1,229 273 1,913 — 15,138
Creditors (74,339) — — (903) — (75,242)
Foreign currency exposure on net monetary
items (62,616) 1,229 273 1,010 — (60,104)
Investments held at fair value through profit
or loss 628,386 22,040 46,825 99,512 32,975 829,738
Total net foreign currency exposure 565,770 23,269 47,098 100,522 32,975 769,634
2023
Swiss Danish Swedish Norwegian
Euro francs krone krona krone Total
£’000 £’000 £’000 £’000 £’000 £’000
Current assets 60,885 1,371 466 540 — 63,262
Creditors (116,811) (148) (761) — — (117,720)
Foreign currency exposure on net monetary
items (55,926) 1,223 (295) 540 — (54,458)
Investments held at fair value through profit
or loss 612,271 71,729 15,842 131,884 7,856 839,582
Total net foreign currency exposure 556,345 72,952 15,547 132,424 7,856 785,124
In the opinion of the Directors, the above year end amounts are broadly representative of the exposure to foreign currency
risk throughout the year.
Foreign currency sensitivity
The following table illustrates the sensitivity of return after taxation for the year and net assets with regard to the
Company’s monetary financial assets and financial liabilities and exchange rates. The sensitivity analysis is based on the
Company’s monetary currency financial instruments held at each balance sheet date and the income receivable in
foreign currency and assumes a 10% (2023: 10%) appreciation or depreciation in sterling against the Euro, Swiss francs,
Danish krone, Swedish krona, Norwegian krone and US dollar to which the Company is exposed. This is considered to be
a reasonable illustration based on the volatility of exchange rates during the year.
84 JPMorgan European Discovery Trust plc – Annual Report & Financial Statements 2024
Notes to the Financial Statements
Financial Statements
European Discovery AR 05 Financial Statements p68-90.qxp 20/06/2024 09:52 Page 84

J.P. Morgan Asset Management 85
Notes to the Financial Statements
Financial Statements
2024 2023
If sterling If sterling If sterling If sterling
strengthens weakens strengthens weakens
by 10% by 10% by 10% by 10%
£’000 £’000 £’000 £’000
Statement of Comprehensive Income –
return after taxation
Revenue return
1
(2,373) 2,373 (2,239) 2,239
Capital return 6,010 (6,010) 5,446 (5,446)
Total return after taxation for the year 3,637 (3,637) 3,207 (3,207)
Net assets 3,637 (3,637) 3,207 (3,207)
1
The sensitivity is calculated on the income received during the year.
In the opinion of the Directors, the above sensitivity analysis is broadly representative of the whole year.
(ii) Interest rate risk
Interest rate movements may affect the level of income receivable on cash deposits, the liquidity fund and the interest
payable on variable rate borrowings when interest rates are reset.
Management of interest rate risk
The Company does not normally hold significant cash balances. Short term borrowings are used when required. The
Company may finance part of its activities through borrowings at levels approved and monitored by the Board.
The possible effects on cash flows that could arise as a result of changes in interest rates are taken into account when
the Company borrows on the floating rate loan facility. However, amounts drawn down on this facility are for short term
periods and therefore there is limited exposure to interest rate risk.
Derivatives are not used to hedge against the exposure to interest rate risk.
Interest rate exposure
The Company has a loan carrying a variable rate of interest and the exposure is therefore already quantifiable. The
exposure of financial assets and liabilities to floating interest rates using the year end figures, giving cash flow interest
rate risk when rates are reset, is shown below.
2024 2023
£’000 £’000
Exposure to floating interest rates:
Cash and short term deposits 312 447
Bank overdraft (394) —
JPMorgan Euro Liquidity Fund 7,242 46,553
Bank loan (72,670) (109,836)
Total exposure (65,510) (62,836)
Interest receivable on cash balances, or paid on overdrafts, is at a margin below or above SONIA respectively (2023:
Interest receivable on cash balances, or paid on overdrafts, is at a margin below or above SONIA respectively). Interest
payable on the Bank loan is at a margin above EURIBOR (2023: margin above EURIBOR).
European Discovery AR 05 Financial Statements p68-90.qxp 20/06/2024 09:52 Page 85

21. Financial instruments’ exposure to risk and risk management policies (continued)
(a) Market risk (continued)
(ii) Interest rate risk (continued)
Interest rate sensitivity
The following table illustrates the sensitivity of the return after taxation for the year and net assets to a 1% (2023: 4%)
increase or decrease in interest rates with regard to the Company’s monetary financial assets and financial liabilities.
This level of change is considered to be a reasonable illustration based on observation of current market conditions. The
sensitivity analysis is based on the Company’s monetary financial instruments held at the balance sheet date, with all
other variables held constant.
2024 2023
1% 1% 4% 4%
Increase Decrease Increase Decrease
in rate in rate in rate in rate
£’000 £’000 £’000 £’000
Statement of Comprehensive Income
– return after taxation
Revenue return (146) 146 562 (562)
Capital return (509) 509 (3,075) 3,075
Total return after taxation (655) 655 (2,513) 2,513
Net assets (655) 655 (2,513) 2,513
In the opinion of the Directors, this sensitivity analysis may not be representative of the Company’s future exposure to
interest rate changes due to fluctuations in the level of cash balances, cash held in the liquidity fund and amounts drawn
down on the Company’s loan facilities.
(iii)Other price risk
Other price risk includes changes in market prices, other than those arising from interest rate risk or currency risk, which
may affect the value of equity investments.
Management of other price risk
The Board meets on at least five occasions each year to consider the asset allocation of the portfolio and the risk
associated with particular industry sectors. The investment management team has responsibility for monitoring the
portfolio selected in accordance with the Company’s investment objectives and seeks to ensure that individual stocks
meet an acceptable risk/reward profile. At the same time ensuring that the portfolio is in compliance with the agreed
investment guidelines and policies.
Other price risk exposure
The Company’s total exposure to changes in market prices at 31st March comprises its holdings in equity investments as
follows:
2024 2023
£’000 £’000
Investments held at fair value through profit or loss 829,738 839,582
829,738 839,582
The above data is broadly representative of the exposure to other price risk during the current and comparative year.
Concentration of exposure to market price risk
An analysis of the Company’s investments is given on pages 24 and 25. This shows that all of the investments’ value is in
European companies and there is no concentration of exposure to any one country. It should also be noted that an
investment may not be entirely exposed to the economic conditions in its country of domicile or of listing.
86 JPMorgan European Discovery Trust plc – Annual Report & Financial Statements 2024
Notes to the Financial Statements
Financial Statements
European Discovery AR 05 Financial Statements p68-90.qxp 20/06/2024 09:52 Page 86

J.P. Morgan Asset Management 87
Notes to the Financial Statements
Financial Statements
Other price risk sensitivity
The following table illustrates the sensitivity of the return after taxation for the year and net assets to an increase
ordecrease of 10% (2023: 10%) in the market value of equity investments. This level of change is considered to be
areasonable illustration based on observation of current market conditions. The sensitivity analysis is based on the
Company’s equities, adjusting for changes in the management fee but with all other variables held constant.
2024 2023
10% 10% 10% 10%
Increase in Decrease in Increase in Decrease in
fair value fair value fair value fair value
£’000 £’000 £’000 £’000
Statement of Comprehensive Income
– return after taxation
Revenue return (187) 187 (214) 214
Capital return 82,538 (82,538) 83,459 (83,459)
Total return after taxation 82,351 (82,351) 83,245 (83,245)
Net assets 82,351 (82,351) 83,245 (83,245)
(b) Liquidity risk
This is the risk that the Company will encounter difficulty in meeting obligations associated with financial liabilities that are
settled by delivering cash or another financial asset.
Management of the risk
Liquidity risk is mitigated as the Company’s assets comprise mainly readily realisable securities, which can be sold to meet
funding requirements if necessary. Short term flexibility is achieved through the use of overdraft facilities.
The Board’s policy is for the Company to remain fully invested in normal market conditions and that short term borrowings be
used to manage short term liabilities and working capital requirements and to gear the Company as appropriate.
Liquidity risk exposure
Contractual maturities of the financial liabilities, based on the earliest date on which payment can be required are as follows:
2024
More than
Three three months
months but not more More than
or less than one year one year Total
£’000 £’000 £’000 £’000
Creditors
Securities purchased awaiting settlement 1,075 — — 1,075
Repurchase of the Company’s own shares 686 — — 686
Bank overdraft 394 — — 394
Other creditors 165 — — 165
Bank loan, including interest 994 2,821 77,306 81,121
3,314 2,821 77,306 83,441
European Discovery AR 05 Financial Statements p68-90.qxp 20/06/2024 09:52 Page 87

21. Financial instruments’ exposure to risk and risk management policies (continued)
(b) Liquidity risk (continued)
Liquidity risk exposure (continued)
2023
More than
Three three months
months but not more More than
or less than one year one year Total
£’000 £’000 £’000 £’000
Creditors
Securities purchased awaiting settlement 6,823 — — 6,823
Other creditors 208 — — 208
Bank loan, including interest 1,681 111,909 — 113,590
8,712 111,909 — 120,621
The liabilities shown above represent future contractual payments and therefore may differ from the amounts shown in the
Statement of Financial Position.
(c) Credit risk
Credit risk is the risk that the failure of the counterparty to a transaction to discharge its obligations under that transaction
could result in loss to the Company.
Management of credit risk
Portfolio dealing
The Company invests in markets that operate Delivery Versus Payment (‘DVP’) settlement. The process of DVP mitigates the
risk of losing the principal of a trade during the settlement process. The Manager continuously monitors dealing activity to
ensure best execution, a process that involves measuring various indicators including the quality of trade settlement and
incidence of failed trades. Counterparty lists are maintained and adjusted accordingly.
Cash and cash equivalents
Counterparties are subject to regular credit analysis by the Manager and deposits can only be placed with counterparties
that have been approved by JPMAM’s Counterparty Risk Group. The Board regularly reviews the counterparties used by the
Manager. The JPMorgan Euro Liquidity Fund has a AAA rating.
Exposure to JPMorgan Chase Bank, N.A
JPMorgan Chase Bank, N.A. is the custodian of the Company’s assets. The Company’s assets are segregated from
JPMorgan Chase’s own trading assets. Therefore these assets are designed to be protected from creditors in the event that
JPMorgan Chase were to cease trading. The Depositary, BNY Mellon Trust and Depositary (UK) Limited, is responsible for the
safekeeping of all custodial assets of the Company and for verifying and maintaining a record of all other assets of the
Company. However, no absolute guarantee can be given on the protection of all the assets of the Company.
Credit risk exposure
The amounts shown in the Statement of Financial Position under debtors and cash and cash equivalents represent the
maximum exposure to credit risk at the current and comparative year ends.
Stock Lending
The aggregate value of securities on loan at 31st March 2024 amounted to £53.0 million (2023: £41.5 million) and the
maximum value of stock on loan during the year amounted to £66.6 million (2023: £41.6 million). Collateral is obtained by
JPMorgan Asset Management and is called in on a daily basis to a minimum value of 102% of the value of the securities on
loan if that collateral is denominated in the same currency as the securities on loan and a minimum of 105% if it is
denominated in a different currency. Full details of the collateral is disclosed on pages 92 to 95.
88 JPMorgan European Discovery Trust plc – Annual Report & Financial Statements 2024
Notes to the Financial Statements
Financial Statements
European Discovery AR 05 Financial Statements p68-90.qxp 20/06/2024 09:52 Page 88

J.P. Morgan Asset Management 89
Notes to the Financial Statements
Financial Statements
(d) Fair values of financial assets and financial liabilities
All financial assets and liabilities are either included in the Statement of Financial Position at fair value or the carrying
amount is a reasonable approximation of fair value.
22. Capital management policies and procedures
The Company’s debt and capital structure comprises the following:
2024 2023
£’000 £’000
Debt
Bank loan 72,670 109,836
Total debt 72,670 109,836
Equity
Called up share capital 7,874 7,874
Reserves 761,172 777,188
Total equity 769,046 785,062
Total debt and equity 841,716 894,898
The Company’s capital management objectives are to ensure that it will continue as a going concern and to maximise the
income and capital return to its equity shareholders through an appropriate level of gearing.
The Board’s policy is to limit gearing within the range of 20% net cash to 20% geared.
2024 2023
£’000 £’000
Investments held at fair value through profit or loss 829,738 839,582
Net assets 769,046 785,062
Gearing/(Net cash) 7.9% 6.9%
The Board, with the assistance of the Manager, monitors and reviews the broad structure of the Company’s capital on an
ongoing basis. This review includes:
– the planned level of gearing, which takes into account the Manager’s views on the market;
– the need to buy back equity shares, either for cancellation or to hold in Treasury, which takes into account the share price
discount or premium;
– the opportunity for issues of new shares, including issues from Treasury; and
– the level of dividend distributions in excess of that which is required to be distributed.
European Discovery AR 05 Financial Statements p68-90.qxp 20/06/2024 09:52 Page 89

90 JPMorgan European Discovery Trust plc – Annual Report & Financial Statements 2024
Notes to the Financial Statements
Financial Statements
23. Analysis of Changes in Net Debt
As at Other As at
31st March non-cash 31st March
2023 Cash flows changes
1
2024
£’000 £’000 £’000 £’000
Cash and cash equivalents
Cash 447 (126) (9) 312
Cash held in JPMorgan Euro Liquidity Fund 46,553 (39,407) 96 7,242
Bank overdraft — (394) — (394)
47,000 (39,927) 87 7,160
Borrowings
Debt due within one year (109,836) — 109,836 —
Debt due after one year — 34,447 (107,117) (72,670)
(109,836) 34,447 2,719 (72,670)
Net debt (62,836) (5,480) 2,806 (65,510)
1
Other non cash changes include foreign currency exchange movements and the classification of the debt due within one year to debt due after one year, as
shown in notes 13 and 14.
24. Subsequent events
The Directors have evaluated the period since the year end and have not noted any material subsequent events.
European Discovery AR 05 Financial Statements p68-90.qxp 20/06/2024 09:52 Page 90

Image:
Regulatory Disclosures
European Discovery AR 06 Regulatory Disclosures p91-95.qxp 20/06/2024 09:52 Page 91

Regulatory Disclosures
92 JPMorgan European Discovery Trust plc – Annual Report & Financial Statements 2024
Regulatory Disclosures
Alternative Investment Fund Managers’ Directive (‘AIFMD’) Disclosures (Unaudited)
Leverage
For the purposes of the Alternative Investment Fund Managers Directive (‘AIFMD’), leverage is any method which increases the
Company’s exposure, including the borrowing of cash and the use of derivatives. It is expressed as a ratio between the
Company’s exposure and its net asset value and is calculated on a gross and a commitment method in accordance with AIFMD.
Under the gross method, exposure represents the sum of the Company’s positions without taking into account any hedging and
netting arrangements. Under the commitment method, exposure is calculated after certain hedging and netting positions are
offset against each other.
The Company’s maximum and actual leverage levels at 31stMarch 2024 are shown below:
Gross Commitment
Method Method
Leverage exposure
Maximum limit 200% 200%
Actual 109.6% 109.4%
JPMorgan Funds Limited (the ‘Management Company’) is the authorised manager of JPMorgan European Discovery Trust plc
(the ‘Company’) and is part of the J.P. Morgan Chase & Co. group of companies. In this section, the terms ‘J.P. Morgan’ or ‘Firm’
refer to that group, and each of the entities in that group globally, unless otherwise specified.
This section of the annual report has been prepared in accordance with the Alternative Investment Fund Managers’ Directive
(the ‘AIFMD’), the European Commission Delegated Regulation supplementing the AIFMD, and the ‘Guidelines on sound
remuneration policies’ issued by the European Securities and Markets Authority under the AIFMD. The information in this section
is in respect of the most recent complete remuneration period (‘Performance Year’) as at the reporting date.
This section has also been prepared in accordance with the relevant provisions of the Financial Conduct Authority Handbook
(FUND 3.3.5).
Remuneration Policy
A summary of the Remuneration Policy currently applying to the Management Company (the ‘Remuneration Policy Statement’)
can be found at https://am.jpmorgan.com/gb/en/asset-management/gim/per/legal/emea-remuneration-policy. This
Remuneration Policy Statement includes details of how remuneration and benefits are calculated, including the financial and
non-financial criteria used to evaluate performance, the responsibilities and composition of the Firm’s Compensation and
Management Development Committee, and the measures adopted to avoid or manage conflicts of interest. A copy of this policy
can be requested free of charge from the Management Company.
The Remuneration Policy applies to all employees of the Management Company, including individuals whose professional
activities may have a material impact on the risk profile of the Management Company or the Alternative Investment Funds it
manages (‘AIFMD Identified Staff’). The AIFMD Identified Staff include members of the board of the Management Company,
senior management, the heads of relevant Control Functions, and holders of other key functions. Individuals are notified of their
identification and the implications of this status on at least an annual basis.
The JPM Fund’s Board reviews and adopts the Remuneration Policy on an annual basis, and oversees its implementation,
including the classification of AIFMD Identified Staff. As at 31stDecember 2022, the Board last reviewed and adopted the
Remuneration Policy in May 2022 with no material changes and was satisfied with its implementation.
Quantitative Disclosures
The table below provides an overview of the aggregate total remuneration paid to staff of the Management Company in respect
of the 2023 Performance Year and the number of beneficiaries. These figures include the remuneration of all staff of JP Morgan
Asset Management (UK) Ltd (the relevant employing entity) and the number of beneficiaries, both apportioned to the
Management Company on an Assets Under Management (‘AUM’) weighted basis.
Due to the Firm’s operational structure, the information needed to provide a further breakdown of remuneration attributable to
the Company is not readily available and would not be relevant or reliable. However, for context, the Management Company
manages 27 Alternative Investment Funds (with 4 sub-funds) and 2 UCITS (with 44 sub-funds) as at 31st December 2023, with
acombined AUM as at that date of £23.99 billion and £20.03 billion respectively.
European Discovery AR 06 Regulatory Disclosures p91-95.qxp 20/06/2024 09:52 Page 92

Regulatory Disclosures
J.P. Morgan Asset Management 93
Regulatory Disclosures
Fixed Variable Total Number of
remuneration remuneration remuneration beneficiaries
All staff of the
Management
Company
(US$’000s) 23,549 15,069 38,618 149
The aggregate 2023 total remuneration paid to AIFMD Identified Staff was US$119,473,000, of which US$1,636,000 relates to
Senior Management and US$117,837,000 relates to other Identified Staff.
1
1
For 2023, the AIFMD identified staff disclosures include employees of the companies to which portfolio management has been formally delegated in
line with the latest ESMA guidance.
Securities Financing Transactions Regulation (‘SFTR’) Disclosures (Unaudited)
The Company engages in Securities Financing Transactions (as defined in Article 3 of Regulation (EU) 2015/2365, securities
financing transactions include repurchase transactions, securities or commodities lending and securities or commodities
borrowing, buy-sell back transactions or sell-buy back transactions and margin lending transactions). In accordance with
Article 13 of the Regulation, the Company’s involvement in and exposures related to SFT for the accounting period ended
31stMarch 2024 are detailed below.
Global Data
Amount of securities on loan
The total value of securities on loan as a proportion of the Fund’s total lendable assets, as at the balance sheet date, is 6.39%.
Total lendable assets represents the aggregate value of assets types forming part of the Fund’s securities lending programme.
Amount of assets engaged in securities lending
The following table represents the total value of assets engaged in securities lending:
Value £’000 % of AUM
Securities lending 52,989 6.89%
Concentration and Aggregate Transaction Data
Counterparties
The following table provides details of the counterparties (based on gross volume of outstanding transactions with exposure on
a gross absolute basis) in respect of securities lending as at the balance sheet date:
Collateral
Country of Incorporation Value £’000
Morgan Stanley United States of America 29,056
Merrill Lynch United States of America 6,578
BNP France 4,974
JP Morgan United States of America 4,804
HSBC United Kingdom 1,883
UBS Switzerland 1,466
Barclays United Kingdom 1,423
Citigroup United States of America 1,366
Goldman Sachs United States of America 1,294
Nomura Japan 145
Total 52,989
Maturity tenure of security lending transactions
The Company’s securities lending transactions have open maturity.
European Discovery AR 06 Regulatory Disclosures p91-95.qxp 20/06/2024 09:52 Page 93

Regulatory Disclosures
94 JPMorgan European Discovery Trust plc – Annual Report & Financial Statements 2024
Regulatory Disclosures
Collateral issuers
The following table lists the issuers by value of non-cash collateral received by the Fund by way of title transfer collateral
arrangement across securities lending transactions, as at the balance sheet date:
Collateral Value
Issuer £’000
United States of America Treasury 39,464
French Republic Government 7,184
United Kingdom Treasury 6,104
Kingdom of Belgium Government 2,421
Republic of Austria Government 1,833
Federal Republic of Germany Government 832
Republic of Finland Government 382
Kingdom of Netherlands Government 11
Total 58,231
Non-cash collateral received by way of title transfer collateral arrangement in relation to securities lending transactions cannot
be sold, re-invested or pledged.
Type, quality and currency of collateral
The following table provides an analysis of the type, quality and currency of collateral received by the Fund in respect of
securities lending transactions as at the balance sheet date.
Value
Type Quality Currency £’000
Treasury Bonds Investment Grade USD 29,797
Sovereign Debt Investment Grade EUR 12,663
Treasury Notes Investment Grade USD 9,533
Sovereign Debt Investment Grade GBP 6,104
Treasury Bills Investment Grade USD 134
Total 58,231
Maturity tenure of collateral
The following table provides an analysis of the maturity tenor of collateral received in relation to securities lending transactions
as at the balance sheet date.
Value
Maturity £’000
1 day to 1 week —
1 to 4 weeks 75
1 to 3 months 47
3 to 12 months 270
More than 1 year 57,839
Total 58,231
Settlement and clearing
The Company’s securities lending transactions including related collaterals are settled and cleared either bi-laterally, tri-party or
through a central counterparty.
European Discovery AR 06 Regulatory Disclosures p91-95.qxp 20/06/2024 09:52 Page 94

Re-use of collateral
Share of collateral received that is reused and reinvestment return
Non-cash collateral received by way of title transfer collateral arrangement in relation to securities lending transactions cannot
be sold, re-invested or pledged.
Cash collateral received in the context of securities lending transactions may be reused in accordance with the provisions
contained within the Prospectus. The Company currently reinvests cash collateral received in respect of securities lending
transactions in the overnight cash market.
Safekeeping of collateral
All collateral received (£58,231,000) by the Company in respect of securities lending transactions as at the balance sheet date is
held by the Depository.
Return and cost
JPMorgan Chase Bank, N.A (JPMCB), the lending agent, receives a fee of 10% of the gross revenue for its services related to the
Stock Lending Transactions. The remainder of the revenue, 90%, is received by the Company i.e. for the benefit of Shareholders.
Regulatory Disclosures
J.P. Morgan Asset Management 95
Regulatory Disclosures
European Discovery AR 06 Regulatory Disclosures p91-95.qxp 20/06/2024 09:52 Page 95

Image:
Shareholder Information
European Discovery AR 07 Shareholder Information p96-106.qxp 20/06/2024 09:53 Page 96

Notice of Annual General Meeting
J.P. Morgan Asset Management 97
Shareholder Information
Notice is hereby given that the Annual General Meeting of JPMorgan European Discovery Trust plc will be held at 60 Victoria
Embankment, London EC4Y 0JP on Wednesday, 24th July 2024 at 12.30 p.m. for the following purposes:
1. To receive the Directors’ Report, the Financial Statements
and the Auditors’ Report for the year ended 31st March
2024.
2. To approve the Directors’ Remuneration Policy.
3. To approve the Directors’ Remuneration Report for the year
ended 31st March 2024.
4. To declare a final dividend of 8.0 pence per share.
5. To reappoint Marc van Gelder as a Director of the
Company.
6. To reappoint Sarah Watters as a Director of the Company.
7. To reappoint Suzy Ross as a Director of the Company.
8. To appoint Arun Sarwal as a Director of the Company.
To consider the following resolution as an ordinary resolution:
9. THAT Ernst & Young be reappointed as Auditor of the
Company and that their remuneration be fixed by the
Directors.
Special Business
To consider the following resolutions:
Authority to allot new Ordinary shares – Ordinary
Resolution
10. THAT the Directors of the Company be and they are hereby
generally and unconditionally authorised, (in substitution
of any authorities previously granted to the Directors),
pursuant to and in accordance with Section 551 of the
Companies Act 2006 (the ‘Act’) to exercise all the powers
for the Company to allot shares in the Company and to
grant rights to subscribe for, or to convert any security
into, shares in the Company (‘Rights’) up to an aggregate
nominal amount of £787,375 or, if different the aggregate
nominal amount representing approximately 10% of the
Company’s issued ordinary share capital (excluding
Treasury shares) as at the date of the passing of this
resolution, provided that this authority shall expire at the
conclusion of the Annual General Meeting of the Company
to be held in 2025 unless renewed at a general meeting
prior to such time, save that the Company may before
such expiry make offers, agreements or arrangements
which would or might require shares to be allotted or
Rights to be granted after such expiry and so that the
Directors of the Company may allot shares and grant
Rights in pursuance of such offers or agreements as if the
authority conferred hereby had not expired.
Authority to disapply pre-emption rights on allotment of
relevant securities – Special Resolution
11. THAT subject to the passing of Resolution 10 set out above,
the Directors of the Company be and they are hereby
empowered pursuant to Sections 570 and 573 of the Act to
allot equity securities (within the meaning of Section 560
of the Act) for cash pursuant to the authority conferred by
Resolution 11 or by way of a sale of Treasury shares as if
Section 561(1) of the Act did not apply to any such
allotment, provided that this power shall be limited to the
allotment of equity securities for cash up to an aggregate
nominal amount of £720,157 or, if different, the aggregate
nominal amount representing approximately 10% of the
issued share capital as at the date of the passing of this
resolution at a price of not less than the net asset value
per share and shall expire upon the expiry of the general
authority conferred by Resolution 10 above, save that the
Company may before such expiry make offers,
agreements or arrangements which would or might
require equity securities to be allotted after such expiry
and so that the Directors of the Company may allot equity
securities in pursuance of such offers, agreements or
arrangements as if the power conferred hereby had not
expired.
Authority to repurchase the Company’s shares – Special
Resolution
12. THAT the Company be generally and, subject as
hereinafter appears, unconditionally authorised in
accordance with Section 701 of the Act to make market
purchases (within the meaning of Section 693 of the Act)
of its issued ordinary shares in the capital of the Company
on such terms and in such manner as the Directors may
from time to time determine:
PROVIDED ALWAYS THAT
(i) the maximum number of ordinary shares hereby
authorised to be purchased shall be the number of
ordinary shares which is equal to 14.99% of the Company’s
issued share capital (less shares held in Treasury) as at
the date of the passing of this Resolution;
(ii) the minimum price which may be paid for an ordinary
share shall be the nominal value of such ordinary share;
(iii) the maximum price which may be paid for an ordinary
share shall be an amount equal to the highest of:
(a)105%of the average of the middle market quotations
for an ordinary share taken from and calculated by
reference to the London Stock Exchange Daily Official List
for the fivebusiness days immediately preceding the day
on which the ordinary share is contracted to be
purchased; or (b)the price of the last independent trade;
or (c) the highest current independent bid;
European Discovery AR 07 Shareholder Information p96-106.qxp 20/06/2024 09:53 Page 97

Notice of Annual General Meeting
98 JPMorgan European Discovery Trust plc – Annual Report & Financial Statements 2024
Shareholder Information
(iv) any purchase of ordinary shares will be made in the
market for cash at prices below the prevailing net asset
value per ordinary share (as determined by the Directors);
(v) the authority hereby conferred shall expire on
23rdJanuary 2026 unless the authority is renewed at the
Company’s Annual General Meeting in 2025 or at any
other general meeting prior to such time; and
(vi) the Company may make a contract to purchase ordinary
shares under the authority hereby conferred prior to the
expiry of such authority which contract will or may be
executed wholly or partly after the expiry of such authority
and may make a purchase of ordinary shares pursuant to
any such contract.
Authority to hold general meetings – Special Resolution
13. THAT a general meeting, other than an Annual General
Meeting, may be called on no less than 14 clear days’
notice.
By order of the Board
Priyanka Vijay Anand
for and on behalf of JPMorgan Funds Limited,
Company Secretary
19th June 2024
Notes
These notes should be read in conjunction with the notes on
the reverse of the proxy form.
1. If law or Government guidance so requires at the time of
the Meeting, the Chairman of the Meeting will limit, in his
sole discretion, the number of individuals in attendance at
the Meeting. In addition, the Company may still impose
entry restrictions on certain persons wishing to attend the
AGM in order to secure the orderly and proper conduct of
the Meeting.
2. A member entitled to attend and vote at the meeting may
appoint another person(s) (who need not be a member of
the Company) to exercise all or any of his rights to attend,
speak and vote at the meeting. A member can appoint
more than one proxy in relation to the meeting, provided
that each proxy is appointed to exercise the rights
attaching to different shares held by him.
3. A proxy does not need to be a member of the Company but
must attend the Meeting to represent you. Your proxy
could be the Chairman, another Director of the Company
or another person who has agreed to attend to represent
you. Details of how to appoint the Chairman or another
person(s) as your proxy or proxies using the proxy form are
set out in the notes to the proxy form. If a voting box on the
proxy form is left blank, the proxy or proxies will exercise
his/their discretion both as to how to vote and whether
he/they abstain(s) from voting. Your proxy must attend the
Meeting for your vote to count. Appointing a proxy or
proxies does not preclude you from attending the Meeting
and voting in person.
4. Any instrument appointing a proxy, to be valid, must be
lodged in accordance with the instructions given on the
proxy form no later than 12.30 p.m. two business days prior
to the Meeting (i.e. excluding weekends and bank
holidays).
5. You may change your proxy instructions by returning
anew proxy appointment. The deadline for receipt of proxy
appointments (see above) also applies in relation to
amended instructions. Any attempt to terminate or amend
a proxy appointment received after the relevant deadline
will be disregarded. Where two or more valid separate
appointments of proxy are received in respect of the same
share in respect of the same Meeting, the one which is last
received (regardless of its date or the date of its signature)
shall be treated as replacing and revoking the other or
others as regards that share; if the Company is unable to
determine which was last received, none of them shall be
treated as valid in respect of that share.
6. To be entitled to attend and vote at the Meeting (and for
the purpose of the determination by the Company of the
number of votes they may cast), members must be
entered on the Company’s register of members as at
6.30p.m. two business days prior to the Meeting
European Discovery AR 07 Shareholder Information p96-106.qxp 20/06/2024 09:53 Page 98

Notice of Annual General Meeting
J.P. Morgan Asset Management 99
Shareholder Information
(the‘specified time’). If the Meeting is adjourned to a time
not more than 48 hours after the specified time applicable
to the original Meeting, that time will also apply for the
purpose of determining the entitlement of members to
attend and vote (and for the purpose of determining the
number of votes they may cast) at the adjourned Meeting.
If, however, the Meeting is adjourned for a longer period
then, to be so entitled, members must be entered on
theCompany’s register of members as at 6.30 p.m.
twobusiness days prior to the adjourned Meeting or, if the
Company gives notice of the adjourned Meeting, at the
time specified in that notice. Changes to entries on the
register after this time shall be disregarded in determining
the rights of persons to attend or vote at the Meeting or
adjourned Meeting.
7. A corporation, which is a shareholder, may appoint
individuals to act as its representatives and to vote in
person at the meeting (see instructions given on the proxy
form). In accordance with the provisions of the Companies
Act 2006, each such representative may exercise (on
behalf of the corporation) the same powers as the
corporation could exercise if it were an individual member
of the company, provided that they do not do so in relation
to the same shares. It is therefore no longer necessary to
nominate a designated corporate representative.
Representatives should bring to the Meeting evidence of
their appointment, including any authority under which it
is signed.
8. Members that satisfy the thresholds in Section 527 of the
Companies Act 2006 can require the Company to publish
a statement on its website setting out any matter relating
to: (a) the audit of the Company’s accounts (including the
Auditors’ report and the conduct of the audit) that are to
be laid before the Meeting; or (b) any circumstances
connected with Auditors of the Company ceasing to hold
office since the previous Meeting, which the members
propose to raise at the Meeting. The Company cannot
require the members requesting the publication to pay its
expenses. Any statement placed on the website must also
be sent to the Company’s Auditors no later than the time it
makes its statement available on the website. The
business which may be dealt with at the Meeting includes
any statement that the Company has been required to
publish on its website pursuant to this right.
9. Pursuant to Section 319A of the Companies Act 2006, the
Company must cause to be answered at the Meeting any
question relating to the business being dealt with at the
Meeting which is put by a member attending the Meeting
except in certain circumstances, including if it is
undesirable in the interests of the Company or the good
order of the Meeting or if it would involve the disclosure of
confidential information.
10. Under Sections 338 and 338A of the 2006 Act, members
meeting the threshold requirements in those sections
have the right to require the Company: (i) to give, to
members of the Company entitled to receive notice of the
Meeting, notice of a resolution which those members
intend to move (and which may properly be moved) at the
Meeting; and/or (ii) to include in the business to be dealt
with at the Meeting any matter (other than a proposed
resolution) which may properly be included in the
business at the Meeting. A resolution may properly be
moved, or a matter properly included in the business
unless: (a) (in the case of a resolution only) it would, if
passed, be ineffective (whether by reason of any
inconsistency with any enactment or the Company’s
constitution or otherwise); (b) it is defamatory of any
person; or (c) it is frivolous or vexatious. A request made
pursuant to this right may be in hard copy or electronic
form, must identify the resolution of which notice is to be
given or the matter to be included in the business, must
be accompanied by a statement setting out the grounds
for the request, must be authenticated by the person(s)
making it and must be received by the Company not later
than the date that is six clear weeks before the Meeting,
and (in the case of a matter to be included in the business
only) must be accompanied by a statement setting out the
grounds for the request.
11. A copy of this Notice of Meeting has been sent for
information only to persons who have been nominated by
a member to enjoy information rights under Section 146 of
the Companies Act 2006 (a ‘Nominated Person’). The
rights to appoint a proxy cannot be exercised by a
Nominated Person: they can only be exercised by the
member. However, a Nominated Person may have a right
under an agreement between him and the member by
whom he was nominated to be appointed as a proxy for
the Meeting or to have someone else so appointed.
IfaNominated Person does not have such a right or does
not wish to exercise it, he may have a right under such an
agreement to give instructions to the member as to the
exercise of voting rights.
12. In accordance with Section 311A of the Companies
Act2006, the contents of this Notice of Meeting, details of
the total number of shares in respect of which members
are entitled to exercise voting rights at the Meeting, the
total voting rights members are entitled to exercise at the
Meeting and, if applicable, any members’ statements,
members’ resolutions or members’ matters of business
received by the Company after the date of this Notice of
Meeting will be available on the Company’s website
www.jpmeuropeandiscovery.co.uk
European Discovery AR 07 Shareholder Information p96-106.qxp 20/06/2024 09:53 Page 99

Notice of Annual General Meeting
100 JPMorgan European Discovery Trust plc – Annual Report & Financial Statements 2024
Shareholder Information
13. The register of interests of the Directors and connected
persons in the share capital of the Company and the
Directors’ letters of appointment are available for
inspection at the Company’s registered office during
usual business hours on any weekday (Saturdays,
Sundays and public holidays excepted). They will also be
available for inspection at the Meeting. No Director has
any contract of service with the Company.
14. You may not use any electronic address provided in this
Notice of Meeting to communicate with the Company for
any purposes other than those expressly stated.
15. As an alternative to completing a hard copy Form of Proxy/
Voting Instruction Form, you can appoint a proxy or proxies
electronically by visiting www.sharevote.co.uk
. You will
need your Voting ID, Task ID and Shareholder Reference
Number (this is the series of numbers printed under your
name on the Form of Proxy/Voting Instruction Form).
Alternatively, if you have already registered with Equiniti
Limited’s online portfolio service, Shareview, you can
submit your Form of Proxy at www.shareview.co.uk
. Full
instructions are given on both websites.
16. As at 18th June 2024 (being the latest business day prior to
the publication of this Notice), the Company’s issued
share capital consists of 143,286,254 ordinary shares
(excluding Treasury Shares), carrying one vote each.
Therefore, the total voting rights in the Company are
143,286,254.
Electronic appointment – CREST members
CREST members who wish to appoint a proxy or proxies by
utilising the CREST electronic proxy appointment service may
do so for the Meeting and any adjournment(s) thereof by
using the procedures described in the CREST Manual. See
further instructions on the proxy form.
European Discovery AR 07 Shareholder Information p96-106.qxp 20/06/2024 09:53 Page 100

Alternative Performance Measures (‘APMS’) and Glossary of Terms (Unaudited)
J.P. Morgan Asset Management 101
Shareholder Information
Alternative Performance Measure (APM)
Alternative Performance Measures (APMs) are numerical measures of current, historical or future financial performance,
financial position or cash flow that are not GAAP measures. APMs are intended to supplement the information in the financial
statements, providing useful industry-specific information that can assist shareholders to better understand the performance
of the Company.
Where a measure is labelled as an APM, a definition and reconciliation to a GAAP measure is set out below.
Return to Shareholders (APM)
Total return to the shareholder, on a last traded price to last traded price basis, assuming that all dividends received were
reinvested, without transaction costs, into the shares of the Company at the time the shares were quoted ex-dividend.
Year ended Year ended
31st March 31st March
Total return calculation Page 2024 2023
Opening share price (p) 6 423.0 450.0 (a)
Closing share price (p) 6 465.5 423.0 (b)
Total dividend adjustment factor
1
1.026517 1.018071 (c)
Adjusted closing share price (d = b x c) 477.8 430.6 (d)
Total return to shareholders (e = (d / a) – 1) +13.0% –4.3% (e)
1
The dividend adjustment factor is calculated on the assumption that the dividends paid out by the Company are reinvested into the shares of the
Company at the last traded price quoted at the ex-dividend date.
Return on Net Assets (APM)
Total return on net asset value (‘NAV’) per share, on a bid value to bid value basis, assuming that all dividends paid out by the
Company were reinvested, without transaction costs, into the shares of the Company at the NAV per share at the time the shares
were quoted ex-dividend.
Year ended Year ended
31st March 31st March
Total return calculation Page 2024 2023
Opening cum-income NAV per share (p) 6 498.5 526.1 (a)
Closing cum-income NAV per share (p) 6 520.7 498.5 (b)
Total dividend adjustment factor
1
1.022423 1.014844 (c)
Adjusted closing cum-income NAV per share (d = b x c) 532.4 505.9 (d)
Total return on net assets (e = (d / a) – 1) +6.8% –3.8% (e)
1
The dividend adjustment factor is calculated on the assumption that the dividends paid out by the Company are reinvested into the shares of the
Company at the cum-income NAV at the ex-dividend date.
Benchmark total return
Total return on the benchmark, on a closing-market value to closing-market value basis, assuming that all dividends received
were reinvested, without transaction costs, in the shares of the underlying companies at the time the shares were quoted
ex-dividend.
The benchmark is a recognised index of stocks which should not be taken as wholly representative of the Company’s
investment universe. The Company’s investment strategy does not follow or ‘track’ this index and consequently, there may be
some divergence between the Company’s performance and that of the benchmark.
Net asset value per share
The value of the Company’s net assets (total assets less total liabilities) divided by the number of ordinary shares in issue. Please
see note 17 on page 81 for detailed calculations.
European Discovery AR 07 Shareholder Information p96-106.qxp 20/06/2024 09:53 Page 101

Alternative Performance Measures (‘APMS’) and Glossary of Terms (Unaudited)
102 JPMorgan European Discovery Trust plc – Annual Report & Financial Statements 2024
Shareholder Information
Gearing/(Net Cash) (APM)
Gearing represents the excess amount above shareholders’ funds of total investments, expressed as a percentage of the
shareholders’ funds. If the amount calculated is negative, this is shown as a ‘net cash’ position.
31st March 31st March
2024 2023
Gearing calculation Page £’000 £’000
Investments held at fair value through profit or loss 71 829,738 839,582 (a)
Net assets 6 769,046 785,062 (b)
Gearing (c = (a / b) – 1) 7.9% 6.9% (c)
Ongoing charges (APM)
The ongoing charges represent the Company’s management fee and all other operating expenses excluding finance costs
payable, expressed as a percentage of the average of the daily cum-income net assets during the year and is calculated in
accordance with guidance issued by the Association of Investment Companies.
Year ended Year ended
31st March 31st March
Ongoing charges calculation Page 2024 2023
Management fee (£’000) 69 5,773 6,416
Other administrative expenses (£’000) 69 860 690
Total management fee and other administrative
expenses (£’000) 6,633 7,106 (a)
Average daily cum-income net assets 717,766 753,063 (b)
Ongoing charges (c = a / b) 0.92% 0.94% (c)
Share Price Discount/Premium to Net Asset Value (‘NAV’) per Share (APM)
If the share price of an investment trust is lower than the NAV per share, the shares are said to be trading at a discount. The
discount is shown as a percentage of the NAV per share.
The opposite of a discount is a premium. It is more common for an investment trust’s shares to trade at a discount than at
apremium.
Year ended Year ended
31st March 31st March
Page 2024 2023
Share price (p) 6 465.5 423.0 (a)
Net assets value per share with debt at par value (p) 6 520.7 495.5 (b)
Discount to net asset value with debt at fair
value (c = (a – b)/b) 10.6% 15.1% (c)
European Discovery AR 07 Shareholder Information p96-106.qxp 20/06/2024 09:53 Page 102

Investing in JPMorgan European Discovery Trust plc
J.P. Morgan Asset Management 103
Shareholder Information
You can invest in a J.P. Morgan investment trust through the
following:
1. Via a third party provider
Third party providers include:
Please note this list is not exhaustive and the availability of
individual trusts may vary depending on the provider. These
websites are third party sites and J.P. Morgan Asset
Management does not endorse or recommend any. Please
observe each site’s privacy and cookie policies as well as
their platform charges structure.
2. Through a professional adviser
Professional advisers are usually able to access the products
of all the companies in the market and can help you to find an
investment that suits your individual circumstances.
Anadviser will let you know the fee for their service before you
go ahead. You can find an adviser at unbiased.co.uk
.
You may also buy investment trusts through stockbrokers,
wealth managers and banks.
To familiarise yourself with the Financial Conduct Authority
(FCA) adviser charging and commission rules, visit fca.org.uk
.
3. Voting on Company Business and Attending
the AGM
The Board encourages its shareholders to exercise their
rights by voting at general meetings and attending if able to
do so. If you hold your shares on the Company’s main register,
please refer to the notes to the AGM on page 102 and your
form of proxy. If your shares are held through a platform,
platform providers often provide shareholders with the ability
to receive company documentation, to vote their shares and
to attend general meetings, at no cost. Please refer to your
investment platform for more details, or visit the Association
of Investment Companies’ (‘AIC’) website at
www.theaic.co.uk/aic/shareholder-voting-consumer-platforms
for information on which platforms support these services
and how to utilise them.
AJ Bell Investcentre
Barclays Smart investor
Charles Stanley Direct
Fidelity Personal Investing
Halifax Share Dealing
Hargreaves Lansdown
Interactive investor
European Discovery AR 07 Shareholder Information p96-106.qxp 20/06/2024 09:53 Page 103

Share Fraud Warning
104 JPMorgan European Discovery Trust plc – Annual Report & Financial Statements 2024
Shareholder Information
Investment and pension scams are
òé÷èñöòóëìö÷ìæä÷èçäñççìĦæøï÷÷òöóò÷
Be a ScamSmart investor and spot the warning signs
Fraudsters will often:
• contact you out of the blue
• apply pressure to invest quickly
• downplay the risks to your money
• promise tempting returns that sound too good to be true
• öäü÷ëä÷÷ëèüđõèòñïüðäîìñê÷ëèòģèõäùäìïäåïè÷òüòøòõ
even ask you to not tell anyone else about it
How to avoid investment and pension scams
Òéüòøđõèöøöóìæìòøöõèóòõ÷ì÷
Yòøæäñõèóòõ÷÷ëèĤõðòõöæäð÷òøöåü
contacting our Consumer Helpline on
0800 111 6768 or using our reporting form
using the link below.
If you’ve lost money in a scam, contact
Action Fraud on 0300 123 2040 or
www.actionfraud.police.uk
Ûèíèæ÷øñèûóèæ÷èçòģèõö
Scammers usually cold call, but contact
can also come by email, post, word of mouth
òõä÷äöèðìñäõÒéüòøđùèåèèñòģèõèçäñ
investment out of the blue, chances are it’s
a high risk investment or a scam.
Check the FCA Warning List
Use the FCA Warning List to check the risks
of a potential investment – you can also search
÷òöèèìé÷ëèĤõðìöîñòúñ÷òåèòóèõä÷ìñêúì÷ëòø÷
our authorisation.
Ðè÷ìðóäõ÷ìäïäçùìæè
Get impartial advice before investing – don’t use
äñäçùìöèõéõòð÷ëèĤõð÷ëä÷æòñ÷äæ÷èçüòø
Be ScamSmart and visit
úúúéæäòõêøî¦öæäðöðäõ÷
1
2
3
European Discovery AR 07 Shareholder Information p96-106.qxp 20/06/2024 09:53 Page 104

Information About the Manager
J.P. Morgan Asset Management 105
Shareholder Information
Manager’s Policies regarding Employees, Social, Community, Environment and Human Rights
Issues
JPMAM seeks to deliver stronger financial outcomes, including by focusing on the most financially material ESG issues that it
believes impact the long-term performance of companies in which it invests. Additionally, it advocates for robust corporate
governance and sound business practices. The Manager believes that understanding financially material ESG factors plays an
important role in delivering long-term value creation for its clients. These efforts are supported through one of the largest
buyside research networks of approximately 300 equity and credit analysts globally, complemented by a dedicated stewardship
team. Every year, the Manager challenges itself to consider how it can better steward its clients’ capital, both in terms of how it
invests and how it operates. The dialogue continues to be shaped by important medium-and longer-term material financial risks
and opportunities faced by investee companies around environmental issues such as climate change and natural capital,
social issues such as labour standards and diversity in the workplace, and governance issues such as board effectiveness and
executive compensation plans aligned with shareholders’ interests.
JPMAM is also a signatory to the United Nations Principles of Responsible Investment, which commits participants to six
principles, with the aim of incorporating ESG criteria into their processes when making stock selection decisions and promoting
ESG disclosure.
The Manager has implemented a policy which seeks to restrict investments in securities issued by companies that have been
identified by an independent third party provider as being involved in the manufacture, production or supply of cluster
munitions, depleted uranium ammunition and armour and/or anti-personnel mines. Shareholders can obtain further details on
the policy by contacting the Manager.
The Modern Slavery Act 2015 (‘MSA’)
JPMorgan’s statement on the MSA can be found on the following website:
https://www.jpmorganchase.com/about/ourbusiness/human-rights
Corporate Governance
JPMAM believes that corporate governance is integral to its investment process. As part of its commitment to delivering superior
investment performance to clients, it expects and encourages the companies in which it invests to demonstrate the highest
standards of corporate governance and best business practice. JPMAM examines the share structure and voting structure of
the companies in which it invests, as well as the board balance, oversight functions and remuneration policy. These analyses
then form the basis of JPMAM’s proxy voting and engagement activity.
Proxy Voting
JPMAM manages the voting rights of the shares entrusted to it as it would manage any other asset. It is the policy of JPMAM to
vote in a prudent and diligent manner, based exclusively on reasonable judgement of what will best serve the financial interests
of clients. So far as is practicable, JPMAM will vote at all of the meetings called by companies in which it is invested.
Stewardship/Engagement
JPMAM believes effective investment stewardship can materially contribute to helping build stronger portfolios over the long
term for our clients. At the heart of JPMAMs approach lies a close collaboration between our portfolio managers, research
analysts and investment stewardship specialists to engage with the companies in which JPMAM invests. Regular engagement
with JPMAMs investee companies through investment-led stewardship has been a vital component of JPMAMs active
management heritage.
JPMAM continues to exercise active ownership through regular and ad hoc meetings, and through its voting responsibilities.
JPMAM’s formal stewardship structure is designed to identify risks and understand its portfolio companies’ activities, in order
to enhance value and mitigate risks associated with them. JPMAM has identified six main investment stewardship priorities it
believes have universal applicability and will stand the test of time:
– governance;
– strategy alignment with the long term;
– human capital management;
– natural capital and ecosystems;
– stakeholder engagement; and
– climate risk.
European Discovery AR 07 Shareholder Information p96-106.qxp 20/06/2024 09:53 Page 105

Information About the Manager
106 JPMorgan European Discovery Trust plc – Annual Report & Financial Statements 2024
Shareholder Information
Within each priority area, JPMAM identified related themes it is seeking to address over a shorter time frame. These themes will
evolve as JPMAM engages with companies to understand issues and promote best practice. This combination of long-term
priorities and evolving, shorter-term themes provides JPMAM with a structured and targeted framework to guide its investors
and investment stewardship teams globally as JPMAM engages with investee companies around the world.
JPMAM is also committed to reporting more widely on our activities, including working to meet the practices laid out by the
Financial Reporting Council (‘FRC’) in the UK Stewardship Code, to which JPMAM is a signatory.
JPMAM’s Voting Policy and Corporate Governance Guidelines are available on request from the Company Secretary or can be
downloaded from JPMAM’s website: https://am.jpmorgan.com/content/dam/jpm-am-
aem/americas/us/en/supplemental/proxy-information/global-procedures-and-guidelines.pdf and at
https://www.jpmorganchase.com/about/governance/corporate-governance-principles
Financial Conduct Authority (‘FCA’) Regulation of ‘non-mainstream pooled investments’, MiFID II
‘complex investments’
The Company currently conducts its affairs so that the shares issued by the Company can be recommended by independent
financial advisers to ordinary retail investors in accordance with the FCA’s rules in relation to non-mainstream investment
products and intends to continue to do so for the foreseeable future. The shares are excluded from the FCA’s restrictions which
apply to non-mainstream investment products because they are shares in an investment trust. The Company’s ordinary shares
are not considered to be ‘complex instruments’ under the FCA’s ‘Appropriateness’ rules and guidance in the COB sourcebook.
Consumer Duty Value Assessment
The Manager has conducted an annual value assessment on the Company in line with FCA rules set out in the Consumer Duty
regulation. The assessment focuses on the nature of the product, including benefits received and its quality, limitations that are
part of the product, expected total costs to clients and target market considerations. Within this, the assessment considers
quality of services, performance of the Company (against both benchmark and peers), total fees (including management fees
and entry and exit fees as applicable to the Company), and also considers whether all consumers, including vulnerable
consumers, are able to receive fair value from the product. The Manager has concluded that the Company is providing value
based on the above assessment.
Task Force on Climate-related Financial Disclosures
As a regulatory requirement, JPMorgan Asset Management (JPMAM) published its first UK Task Force on Climate-related
Financial Disclosures (‘TCFD’) Report for the Company in respect of the year ended 31st December 2022 on 30th June 2023.
Thereport discloses estimates of the Company’s portfolio climate-related risks and opportunities according to the Financial
Conduct Authority (FCA) Environmental, Social and Governance (ESG) Sourcebook and the Task Force on Climate-related
Disclosures (TCFD). The report is available on the Company’s website under the ESG documents section:
https://am.jpmorgan.com/content/dam/jpm-am-aem/emea/regional/en/regulatory/esg-information/jpm-european-
discovery-trust-plc-fund-tcfd-report-uk-per.pdf
The Board is aware that best practice reporting under TCFD is still evolving with respect to metrics and input data quality, as well
as the interpretation and implications of the outputs produced, and will continue to monitor developments as they occur.
European Discovery AR 07 Shareholder Information p96-106.qxp 20/06/2024 09:53 Page 106

Information About the Company
J.P. Morgan Asset Management 107
Shareholder Information
A member of the AIC
History
On 24th April 1990, the Company acquired the undertaking
and assets of Fleming European Fledgeling Fund Limited (the
‘Fund’) in exchange for the issue of its shares and warrants.
That Fund was an open-ended, unquoted investment
company based in Jersey with the same objectives and
investment policies as the Company. The Company changed
its name from JPMorgan European Smaller Companies Trust
plc to JPMorgan European Discovery Trust plc on 15th June
2021. It is a constituent of the FTSE 250 index.
Company Numbers
Company registration number: 2431143
London Stock Exchange number: 0341969
ISIN: GB00BMTS0Z37
Bloomberg code: JEDT LN
LEI: 54930049CEWDI46Y3U28
Market Information
The Company’s net asset value (‘NAV’) per share is published
daily, via the London Stock Exchange. The Company’s shares
are listed on the London Stock Exchange. Themarket price is
shown daily in the Financial Times and on the Company’s
website at www.jpmeuropeandiscovery.co.uk
. where the share
price is updated every15 minutes during trading hours.
Website
www.jpmeuropeandiscovery.co.uk
Share Transactions
The Company’s shares may be dealt indirectly through
astockbroker or professional adviser acting on an investor’s
behalf.
Manager and Company Secretary
JPMorgan Funds Limited.
Company’s Registered Office
60 Victoria Embankment
London EC4Y 0JP
Telephone: 020 7742 4000
For company secretarial issues and administrative matters,
please contact Priyanka Vijay Anand.
Depositary
The Bank of New York Mellon (International) Limited
1 Canada Square
London E14 5AL
The Depositary has appointed JPMorgan Chase Bank, N.A. as
the Company’s custodian.
Registrars
Equiniti Limited
Reference 1083
Aspect House
Spencer Road
Lancing
West Sussex BN99 6DA
Telephone: 0371 384 2325
Lines open 8.30 a.m. to 5.30 p.m. Monday to Friday. Calls to the
helpline will cost no more than a national rate call to a 01 or 02
number. Callers from overseas should dial +44 121 415 0225.
Notifications of changes of address and enquiries regarding
share certificates or dividend cheques should be made in
writing to the Registrar quoting reference 1083.
Registered shareholders can obtain further details on their
holdings on the internet by visiting www.shareview.co.uk
Please Note: Computershare Investor Services Plc will be
replacing Equiniti as the Company’s Registrar later this year.
Further information including full contact details will be made
available to shareholders nearer the time and will be
incorporated into all future shareholder communications
following the transition.
Independent Auditors
Ernst & Young LLP
Statutory Auditor
Atria One
144 Morrison Street
Edinburgh EH3 8EB
Brokers
Cavendish Financial plc
One Bartholomew Close
London EC1A 7BL
European Discovery AR 4pp cover.qxp 20/06/2024 09:47 Page 107

GB A112 | 06/24
CONTACT
60 Victoria Embankment
London
EC4Y 0JP
Freephone: 0800 20 40 20
Calls from outside the UK: +44 1268 44 44 70
Website: www.jpmeuropeandiscovery.co.uk
European Discovery AR 4pp cover.qxp 20/06/2024 09:47 Page BC2
